SuddenDeath
Legendary member
- Messages
- 14,063
- Likes
- 143
and so my charts worked out just fine🙂....i think sometimes you complicate things a bit sd....
"keep it simple" ok I will do that
and so my charts worked out just fine🙂....i think sometimes you complicate things a bit sd....
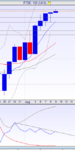
yesterdays FTSE daily candle was that a "hanging man" anyone know their candles?
Reversal. Combine that with the adx divergence.
"keep it simple" ok I will do that
only my opinion sd ...i should have said too complicated for me to understand
honestly i only do charts ....rarely look at anything else🙂
.........................Reversal...........
pivots are pretty simple
"sp500 100% bullish"
instead of writing "buy 5804" I will replace the "buy" with an arrow :arrowu:
did u read the article link I posted from zero hedge this morning
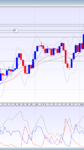
using that adx indicator what level did it say to get long on ftse from mid july 2012
charts say it all in my opinion all the rest is crud..best to stay away from articles and videos and big yellow arrows😆 .....keep a clear mind...
a volume area at 850 according to my crappy data🙂
It gave a long on the 18 July and a sell July 20th
Not necessarily. The theory is that a lower opening traps the "late" longs from the day before which causes downward pressure as they liquidate. That pressure accelerates successively as the longs that brought the price up from the bottom the day before liquidate in turn.
We haven't had that initial "trigger" of the lower open today.
Need to see it on the directly tradeable futures really.
what ever works is good
Some UK data at 9.30 (1min)
and CB leading indicator for UK at 10.00 (CB = conference board)
also possibly signalled a buy at 25th july on the close
so what price the news, SD? Every bit of news recently has been doom and gloom but ftse has ignored it all. Really no point bothering with it imo.