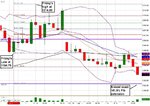
Anyone scalping the FTSE Futures??

Tower this is ghostrider requesting a flyby

Negative ghostrider the FTSE pattern is full

sorry chaps couldnt help myself


the Dow only has to print a price of 11443 to fill the pattern


will be back later to answer the questions

Ok DC.... you need to help me out here :=) I have spent most of today surfing t'internet trying to catch up with you and the nearest I can get to where you could be coming from is that the pattern in the FTSE is one from the harmonic patterns e.g Gartley, Butterfly, Bat etc.. given your quote above I thought you may refering to the Bat pattern. But I cannot see it in the FTSE. Please , please put me out of my bloody misery so I can get some sleep tonight ... many thanks
 
Ok DC.... you need to help me out here :=) I have spent most of today surfing t'internet trying to catch up with you and the nearest I can get to where you could be coming from is that the pattern in the FTSE is one from the harmonic patterns e.g Gartley, Butterfly, Bat etc.. given your quote above I thought you may refering to the Bat pattern. But I cannot see it in the FTSE. Please , please put me out of my bloody misery so I can get some sleep tonight ... many thanks

OKKKKK... now I feel a right chump... suddenly dawned on me , this is a top gun reference to the full pattern isn't it DC?? but what's the name of the pattern so I can check it out?
 
One of the charts I look at when planning my thoughts for the FTSE is the AUD / USA.. why? FTSE is heavily weighted towards commodity players, therefore price of oil, gas, copper etc matter. A big factor in commodity pricing is the weakness / strength of the dollar. Weaker dollar , higher commodity prices. With the Bernank printing money like billy o this has weakened the dollar and sent commodity prices soaring (also China has been buying a lot of stuff). The AUD is a good bellweather as to how the fx traders currently see the commodity trade in terms of risk on and risk off. The upwards trend of strength for the AUD has been remarkable. However, if you look at the chart now you will see an interesting reversal pattern forming (in my view) , you also have to remember that the Ozzie economy is slowing , hence lower interest rates (reduced carry trade) and latest reports from the land downunder is that they are about to have a housing bust of biblical proportions that is going to make the USA sub-prime look like a picnic in relative terms to the two countries GDP. I might even open up a SB account and have a flutter on this myself. Anyone else follow this logic too?

Apologies I can't upload the file, e-signal doesnt seem to allow me to save files in the right format for T2W
 
Ok DC.... you need to help me out here :=) I have spent most of today surfing t'internet trying to catch up with you and the nearest I can get to where you could be coming from is that the pattern in the FTSE is one from the harmonic patterns e.g Gartley, Butterfly, Bat etc.. given your quote above I thought you may refering to the Bat pattern. But I cannot see it in the FTSE. Please , please put me out of my bloody misery so I can get some sleep tonight ... many thanks

Hi DJ
from the earlier post the points are whole points on the FTSE cash I post cash prices as it makes it easier

the pattern you wont find on the tinterweb well not that easily, its a trend pattern made of five days of higher highs higher lows and is generally followed by a specific pattern

get some sleep my friend I will reply tomorrow to PM if thats ok otherwise you will be up all night
 
DOW futures doing alright I see "baby out with bathwater" springs to mind
 
Good day. Clear bounce off the 38% Fib retracement. Now thinking what extension we will get off the open rally.

Been reading DC’s prediction for the week. Monday sell the early high, now will that line up with a early high on the Dow?

Is he Dr Emmett Brown?
 
The board has gone quiet.....how are everyone doing

doing fine here

FTSE might make a little bounce off the 234 if it gets there before US open and if the DOW makes target in two days this may alter plan for wednesday onwards
 
a question for anyone trading with I G can trades be placed prior to 11pm on sunday night last night I saw their home page with prices changing prior to 11pm the price wasnt far off fridays close about 30 points for the dow.
I wondered if this was a price for customers or just for the front page as normally you cant get on the futures until after 11.
 
Good day. Clear bounce off the 38% Fib retracement. Now thinking what extension we will get off the open rally.

Been reading DC’s prediction for the week. Monday sell the early high, now will that line up with a early high on the Dow?

Is he Dr Emmett Brown?

No, but he has built a TARDIS from his old calculator.
Patent Pending No.9407443
 
Hi, y'all

Just got to my desk... Had to go to doctor about getting on a stop smoking programme, decided risk, reward ratio was bad.... Might be a bit grumpy this week.
 
a question for anyone trading with I G can trades be placed prior to 11pm on sunday night last night I saw their home page with prices changing prior to 11pm the price wasnt far off fridays close about 30 points for the dow.
I wondered if this was a price for customers or just for the front page as normally you cant get on the futures until after 11.

Dc - I have IG Index accounts and I don't think you can trade before 11pm on Sunday. Certainly their tick chart shows no prices before then. I did think it used to be 9pm on sunday, but as I don't usually trade outside hours, I haven't checked this myself.

It looks like the Dow just did a 127% extension to the downside. I am waiting to see how much of a retracement we get before the move down continues. The markets gapped down significantly at the open and gold and silver are back in favour. It does look like we have a change of bias from long to short for the next few days.

The FTSE did a 138% extension, which I didn't think was a proper Fib number, so I was a little surprised it didn't go further down and do 150% or 161%. It has now retraced between 50% and 61.8%, so that might be it for any move up, and a retest of lows is next. But it is lunchtime now and there is no telling yet where the yanks want it to open. It doesn't look like the US has retraced enough yet, so maybe we have a little more up to go before an afternoon sell off.
 
So it looks like we retraced almost 61.8% before going back down again. We bounced off the pivot at 5213 and 150% retracement at 5211, but I still think the 161.8% retracement target will get hit at 5198, some time today. The question is when?
 
doing fine here

FTSE might make a little bounce off the 234 if it gets there before US open and if the DOW makes target in two days this may alter plan for wednesday onwards

Is that the target of 10800's for the DOW?. That would be a long way to go by Wednesday. But if it does, are you looking at a reversal then or further downside on your calculations?
 
doing fine here

FTSE might make a little bounce off the 234 if it gets there before US open and if the DOW makes target in two days this may alter plan for wednesday onwards

Uncanny prediction! vg.
 
Surprisingly this is all rather new to me, but I have to post this chart of the ES. We got an almost exact 161.8% Fibonacci extension off Friday's low and high. Now whether the 161.8% holds is another matter. My guess is it comes back and tests it one more time before 4:30pm.
 

Attachments

  • 18 Sept 2011 162% extension on ES.jpg
    18 Sept 2011 162% extension on ES.jpg
    189.9 KB · Views: 149
Top