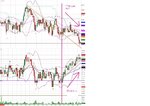
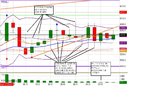
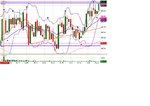
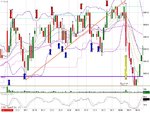
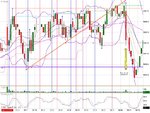
Anyone scalping the FTSE Futures??

Hi
Could I ask you who do you use for your broker and data feed for the futures market ?

I have for years traded the FTSE Index cash market (having been involved with IPOs and analysts days I never trade equities unless I am convinced that I know almost as much as the in house broker/market maker). I should also say I never trade CFD.
My trades can last from mins to days.

By the way you have picked one hell of a month to go live with your trading. I have never known a macro economic and geopolitical time like it !!!

Thanks
FF
Hi fatfinger, I use Open ECry for broker and data feed. I actually opened my account originally with AMP Trading. I basically pay $1.00 per side plus £0.56 in clearing for every FTSE futures contract I trade. AMP was a third party broker using the OEC platform. But they never got on with OEC and transfered all accounts back to OEC a few months ago. OEC agreed to honour the commission rates I was getting from AMP. OEC's commission rates are worse than AMP's but maybe with some haggling you could get the same. If not, try opening an account with Michele Gimenez at Global Futures. I think she is competitive and they still offer the OEC platform.

With OEC you pay no data feed charges, as long as you have a live account. You also have free access to a demo/sim for as long as you want. The OEC data feed is actually from E-signal, and they have recently offered some kind of additional access to E-signals data feed where you you can take the data feed directly. I am happy with the way I have things set up, so have no need to experiment further with the data feed.

Another nice thing with OEC is that you have access to all exchanges, so you can trade/monitor any market you want without having to pay for data feed from other exchanges.

One thing that OEC don't offer is $TICK and $TRIN which is from the NYSE data feed. For a scalper it seems that TICK is important when the US is open. You used to be able to get this free from quote.com, but that has changed.

For my normal trading set up I have the 50 volume, 1 minute, 5 minute and 1 hour charts for the FTSE. I also have the 5 minute ES and FESX, which is really helpful. The FTSE doesn't like blazing a trail on its own, and it is really useful to see confirmation of trends on all three. I also have the 1 hour/daily ES chart for the bigger picture. I use two screens but should add more for ease of use and my eye sight!

The indicators I use are 8 period boly band and 5/10/20 EMAs on all charts. I also watch volume on the 1 min chart, and the ADX/+/- on the 50 volume chart.

As for Macroeconomics, yes these are interesting times. But the time frames that I am interested in have no relation to what is going on in the wide world. If a news event happens out of the blue, I am stopped out at 5 points. I have read lots of stuff recently of people saying inflation is going to be a big problem and get out of equities by year end. I don't know whether to believe them or not. All I have to do is trade what I see, not what I think. Not as easy as it sounds though.
 
/subscribed, good thread mate.. scalping is relevant to my interests too

Doomberg

Welcome aboard too. Nice to see another scalper. Hopefully you are successful and don't mind doing lots of trades.

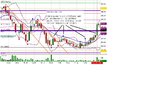
This morning has been another mincy monday, with really only one rally worth trading which was the move up from 5727 to 5747. We had a box trading range from 9:05am to 10:45am. I waited for and took the breakout at 10:45am, which was a damp squib.

The market is trying to separate all of the things going on. Firstly, it got the sell off it had been begging for after the long rally from August last year. It just happened to coincide with all the goings on in North Africa and Arabian Gulf. Then we had the earthquake/Tsunami/Nuclear Accident, and now we have a new war in Libya to take the place of Iraq and Afghanistan. So the market has no idea what to do with itself. A short while ago, traders were saying there were no dips to buy into. Now that they have got the dips, they are being hesitant because of political/environment stuff and not because of economics. The US, Chinese and German economies are doing really well. I am expecting the US to rally again, but I won't trade it unless I see it.
 

Attachments

  • Mon 21st March 2011.JPG 5 min chart.JPG
    Mon 21st March 2011.JPG 5 min chart.JPG
    127.8 KB · Views: 1,020
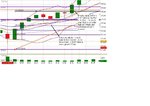
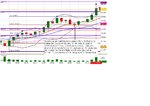
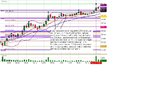
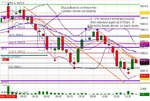
I like days like today. The price action is mostly clean, and it set up after the first 45 minutes as something I call a one way day. A one way day, in this case an up day, continues to make new highs. The first retracement is usually more than 23.6%, most of the time it bounces off the 38%, and occasionally the 50% level, before it goes on to make a new high. After that retracements rarely are more than 23.6%.

It started with an initial uncertainty after the bad news out of Portugal after the market close yesterday, but prior to that news the US Market was strong. At the open, it tried two small pushes down, before all three indices, FTSE, ES and FESX reversed up . The first level to test was last nights gap, which was closed at 5765. The gap traders closed at that point resulting in a small move down, but the FTSE had strength and it broke through the strong resistance level at 5767 at 8:50am.

The next main test was related to the 1296 level on the ES. This was a very big level. It represented the 61.8% retracement for the current sell off of the last two weeks. It had held on three previous tests, so why should it go during Globex hours and not when the main US market was open? The first move up on the FTSE was bullish and it broke the strong resistence level at 5767, when the ES bounced off 1296. But this break up on the FTSE signified strength and the ES followed with it on the next strong move up. We got a nice break up on all indices, and the one way day was confirmed.

On one way days, every time a new high is made, move your 0% line for FIb retracement tool up to the new high and trade the bounce off the 23.6% level or the lower boly band. Essentially longs are relatively safe until the US market starts to wake up around mid-day. A one way day is really a one way morning because when the US is awake the dynamics can change.
 

Attachments

  • Thurs 24th March 2011 9am 5 min chart.JPG
    Thurs 24th March 2011 9am 5 min chart.JPG
    113.2 KB · Views: 1,477
  • Thurs 24th March 2011 9-50am 5 min chart.JPG
    Thurs 24th March 2011 9-50am 5 min chart.JPG
    123.9 KB · Views: 995
  • Thurs 24th March 2011 11-40am 5 min chart.JPG
    Thurs 24th March 2011 11-40am 5 min chart.JPG
    135.3 KB · Views: 1,408
I have been paper trading the FTSE Futures for over a year now, with occasional trades live. I would like to find other FTSE Futures Traders and compare notes.

I am consistently profitable on the Sim, averaging £400 per day allowing for commissions, but to achieve this I am doing 30+ trades per day. I trade one contract only, but add more if a trend continues. My average winner is £35 and my average loser is £20. My win/loss ratio is roughly 60% winners, 40% losers.

I am a very short term trader with most trades lasting 2 to 9 minutes.

My price targets are 6 to 10 points, depending on the price action.

My stops are usually 4.5 points if entered on a limit order, or 5 pts if on a stop order.

I use direct market access trading using the Open ECry platform. You get filled at the bid or the ask, and there is no spread to pay. Most people in the UK seem to use spreadbetting to trade the FTSE cash. They pay a minimum of 0.5 points per side in spread, which costs them £10 per trade, which makes it much harder to make a profit when you are scalping. My fees are £1.81 per trade.

As for strategy, I trade reversals, continuations, pullbacks and breakouts.

With the FTSE, a 2 point move above or below the previous 5 minute candle is significant enough to signal a change of trend most of the time.

I use support and resistance from the 60 minute and daily charts, and watch the 5 min, 1 min and 50 volume charts all the time.

As soon as a reversal is in, I look for retracements to the 38%, 50% and 61.8% levels.

I don't use pivots, but I make a rough note of where they are. They work better for swing trades, and are less accurate for scalping.

A 2 point move away from a S/R or fib level is enough for me to consider a change of trend.

I use the 5 min chart to monitor trends and the 1 minute chart to time my entries.

I watch how price action moves between upper, middle and lower boly bands on the 5 min chart, to decide my bias. This mid line is critical. Below mid bb, take short entries only. Above mid bb, take longs only, unless it bounces off a strong level. Importantly, I use an 8 period setting for bolys on the 5 min chart.

Pullbacks to the 5 EMA on the 5 min chart are good entries for a steady trending market.
Pullbacks to the 5 EMA on the 1 min chart are good entries in rapidly falling/rising markets.

I trade from 8am to 11am usually, and 2:30pm to 4:15pm, UK time. In the morning, I watch the ES and FESX for confirmation of moves by the FTSE. In the afternoon, I watch the ES for trend but trade the FTSE depending on what happens with the ES.

I am trying to reduce the number of trades I take, and cherry pick which trades to take. I also and trying to run my trades longer, but when I get 10 points up I usually close and bank the profit.

I am interested to see how many others scalp the FTSE futures like me, and if they are comfortable taking so many trades in a day. Also what set ups do they use that are successful.

Martin C-J

I am doing like you but a whole lot diffrently. I started very humbly with zero confidence in what I was doing about 3 months ago and now I have even quit my accounting job and doing this full time.

To be honest, I think I am doing well. Though my method is a hell lot different from yours. The good thing about my method is that its ZERO LOSS.

To cut a long story short- I do my FTSE100 trades in BETFAIR (these are 20mins FINANCIALS). You will find that its much easier if you download and use the BETTING ASSISTANT(Gruss). This might sound like gambling but am not gambling but making profits EVERY 20 minutes on Betfair Financials. My personal finances are now excellent as a result.

All you do is register with Betfair and download the BA(its only £6/month), and start trading.

Then-log-on to the BA and go to Financials - FTSE-20 minutes.

1) You then bring up the (20mins) just before it goes IN-PLAY, noting the level of the FTSE100 at the bigining of that 20mins. (whether its 5780,5560 or what ever it was just before the start of the 20minutes. These run from 9am to 4pm UK time.

2) Wait for any(whether down or up) to reach its MINIMUM-say @1.20(LAY). Then you take that twice (LAY) at say - one as 1.20@£2 and and the other as 1.20@ £100. NOW NOTE that you only do this when the odds START moving UPWARDS.(CRUCIAL)

3) To safeguard yourself -Place a BACK as 1.20@£102 and leave it UNMATCHED as the odds drift upwards. (this is for just in case the market turns against you.If it does-this CONTRAs your original entries.
Suppose the odds reach 100, you then ClOSE the deal by BACKING as 100@£2. This GREENSUP on both sides at £100 each and at end of the 20 minutes, your account inreases by £100. Then quickly cancel the BACK(security) of 1.20@£102 before it gets matched.

You do this 21 times per day and end of day you bank £2 100 or even more depending on your stakes. The main thing here is you LOSE NO PENNY at all and you make profits every 20 minutes. Sometimes out of the 21 events you might make 12 or more. To me this is good money without having to analyse this and that or lose.

I recently bought a brand new car using this method.
Am sure you can find my email on this forum-hook me up-maybe we can share more about this.

Well I had tried what you are doing before but it gave me so much pressure. I hope this might help.

Cheers
 
Last edited:
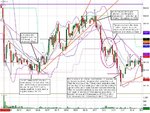
Point no 1on the chart is the opening trade of the day, and it was the gap trade. It was clear most people were looking to close the gap from last night, which was at 5855, which it duly did after the first five minutes.

And after that, it went in to a general drift down to the nine o'clock German Ifo business number (point2). You could have traded it, but it was a slow slog all the way down to nine o'clock, and really, it didn't move a whole lot maybe 10 points. Then right after nine o'clock when the data came out, it was good data, but it didn't set the market on fire. I did go long at five past nine, and luckily caught the spike up (point 3). Now usually a spike like that gets retraced, but it didn't go back up immediately. In fact, it tried one more time to test the lows. It wasn't quite sure what to do with itself.

Point 4 is the candle that tells you the next direction. It tried twice to break the lows, but for me it needed to do that by two clear points. The low of the day at that moment was 5847.5. So I needed to see it print 5845.5 to trigger an entry. It never made it. At 9:20am we got a stong 8 point move up on the 1 minute cahrt, and this up move was confirmed 8 minutes later with a break above 54.0. My short term target was the previous mini high at 60.5 and then on to the high of the morning at 74.5.

At point 5 we had a small bounce off the 60 level (first target), then a continuation of the move up. I went long again at 61.0 at 9:47, which was 2 points above the lowest high of the preceding 1 minute candles. I like to see 2 point moves above prior highs (or lows in downtrends) to trigger my trend continuation entries.

After that it was fairly quickly onto my target at 74.5 and point 6 on the chart. This last candle being the longest of the entire move gives you an idea that this may be the end of the uptrend. The next two five minute candles showed no follow through of the uptrend so it was back down to the middle bolinger band for a bounce.

The bounce did not happen. When the candle closed at 10:20am (point 7) it was clear this was going to head back down again, to somwhere near the lower bolinger band at 62. I was short at 70.5 and closed a little too early at 64.5. I ticked over £300 for the morning, which is always a nice mental target to reach, so I was happy to call it quits. It's a sunny day, and a friday.

ps Since I typed this it is clear that the lower boly did not hold, which then should have given me a target of the lows of the day, which I see it hit and continued lower even.
 

Attachments

  • Fri 25th March 2011 5 min chart.jpg
    Fri 25th March 2011 5 min chart.jpg
    102 KB · Views: 965
teamwk - thank you for your post I will have a look at it over the next few days and let you know what I think when I have a moment. I've never looked at financial betting before.
 
Some observations from todays open:

Firstly, last night the US market sold off strongly in the last half hour. That increased the possibility of a sell off this morning, it was just a question of when and how to catch it.

Overnight the S&P 500 future regained a lot of the fall but didn't quite get back to where it was before the fall. The FTSE opened with a 13 point drop and then tried to go up, but it stalled. The 8:10am, 8:15am, and 8:20am candles struggled to break 5874.0 and could not get above the high of the open, one point higher at 5875.0.

At 8:22am, I got a 2 point break below the low of the prior 1 minute candle, which was enough to signal a double top, and I entered short at 5870.0. My first target was the low of the open, which was 5861.0, and then after that I hoped it would close the gap from last night at 5849.0.

You need to be brave and hold out for these targets. The market is telling you it did not want to go up. It tried several times in the first 20 minutes to make new highs, and it didn't. So the market then needs to test the downside.

On the 5 minute chart the 8:40am and 8:45am candles had sharp pullbacks, and for a moment it looked like there was a battle between sellers and buyers. I usually sell any pullback to the mid boly band on the one minte chart, but I confess I sat out the second pullback at 8:48am. I also had a weak support level at 5855.5 that made me exercise a little caution. But for the brave (not me in this case) and experienced (not me again) who held on, the overnight gap was duly closed at 9:00am.

Then after we got what I call the gap closer's bounce. It retraced 38% and made it to the mid boly band on the 5 min chart. At that point it could go anywhere, and it paid to see where the next 5 min candle would go. The 9:05am candle closed 0.5 points above the middle boly band at 5858.5, and the next candle was a continuation down. It was clear it would test the low at 5846.5 next, but what you don't know is how far below the lows it is going to go. The UK GDP data at 9:30am was going to limit the time for a big push down, so it ground to a halt just prior to the data reaching a low of 5842.5 at 9:28am. I couldn't see any specific support level that determined this. It just ran out time to do anything more.

The GDP data was no big surprise, but the market went on a rally anyway. Maybe in relief that it wasn't worse than expected. I jumped onto the rally a little late, but when it crossed the mid boly band on the 5 min chart, it was clear a bounce was happening. I enetered long at 5852.0, but closed at the 50% retracement when it ran out of steam just shy of the 61.8% retracement.

Now for those who don't use Fib nos, you miss out on a lot. Here was a clear 61.8% retracement. It stopped right on the nose at 5862.5, and when it failed to break it again at 9:55am, the odds were it would sell off, either back to the 23.6% level or back to the low of the day at 5846.5.

It made a new low at 10:35am, and for me this now makes it a one way day, and that any retracements to the 23.6% level should be sold. You got three opportunites to short it at the 23.6% level before you would have been stopped out on the fourth trade. By then it was 12:50pm and getting close to the US influence so you should be probably having your cheese and pickle sandwich by then.
 

Attachments

  • Tues 29th March 2011 8-22am 1 min chart.JPG
    Tues 29th March 2011 8-22am 1 min chart.JPG
    175.8 KB · Views: 1,429
  • Tues 29th March 2011 one way day 5 min chart.JPG
    Tues 29th March 2011 one way day 5 min chart.JPG
    136.1 KB · Views: 1,370
  • Tues 29th March 2011 10-48am 5 min chart.JPG
    Tues 29th March 2011 10-48am 5 min chart.JPG
    117.4 KB · Views: 887
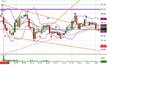
Wednesday mornings ahead of the ADP Non Farms at 1:15pm tend to offer flat wide range days. In other words they tend to cycle between highs and lows in a flat range of about 30 points.

Today started with a big gap up, that the market tried to fill from the open. It failed. The gap was about 30 points which is a big gap to fill. And when it failed on the second attempt at around 9:30am, you can see the gap traders closing shortly afterwards.

We had two triangle breakouts. One up at 8:30am, the second down at 9:18am.

Targets are always the high/low of the first 10 minutes and the overnight gap. Yesterdays big move up in the afternoon, has probably left the market pausing for breath today, hence the smallish range of about 20 points.
 

Attachments

  • Thurs 30th March 2011 1 min chart.JPG
    Thurs 30th March 2011 1 min chart.JPG
    261.1 KB · Views: 1,426
  • Thurs 30th March 2011 5 min chart.JPG
    Thurs 30th March 2011 5 min chart.JPG
    110.9 KB · Views: 979
One other thing happened this afternoon. Usually the FTSE follows the ES almost exactly in afternoon trading. However, today around 15:40, there was clearly manipulation of the FTSE. The FTSE went down while the ES went up. Somebody wanted it to close at lows, possibly even to fill the gap from overnight. They got it down to 5899.5 at 16:29. That's within 1.5 points of last nights close.
 

Attachments

  • Thurs 30th March 2011 FTSE detaches from ES.JPG
    Thurs 30th March 2011 FTSE detaches from ES.JPG
    130.8 KB · Views: 1,145
there are a lot of gap traders around these days

but in such a small time frame you will often find differences between SPX and ES as well
 
more ...

while futs filled its gap ftse cash did not fill its gap
so that leaves open the potential for an island reversal
to catch short termers offside
 
MC - I really don't watch the FTSE cash, and maybe I should do. We did get the reversal, but I don't think that's an island reversal. Maybe you can correct me there.

Interesting to see the market opened up this morning and has ignored the irish news from yesterday. Unless there is a delayed reaction. It is all about the non-farms today, and they should be reasonably good. The ES has retraced almost back to the high of the year, so I would have thought it should go on to retest that high. The Eurostoxx 50 is stalling below the 61.8% level, so maybe europe is obsessing over the soverign debt issue more than the US is. Maybe it will retest lows and drag the FTSE down with it. If it wasn't for the US, the world would be a very bearish place. US results season is just over a week away, so I am expecting good results then and sell off shortly afterwards, around the last week of April.
 
it reversed enough to fill its gap

I keep an eye on Cash because although futs usually leads it can only maintain its rally if Cash follows

so a lower high on the cash was telling
 
There are times when you are better off using your mental capital to do other things. This morning is a good case in point. Everyone is waiting for the ECB announcement at 12:45pm, when they are expected to raise rates. There are also several things going on on the bond auction front. We have spanish and irish bond auctions this morning. Usually bond auctions have no influence on equities, but right now they are important. Yesterday's expensive bond yields for Portugal's auction triggered the concession later in the day that they would need a bale out.

The volumes this morning have been paltry, and since about 8:20am the market has swung wildly and the price action has been inconsistent. It is very tempting to try and trade the swings on the 1 minute chart using small targets and reversing at extremes, but with such low volumes it is hard to predict what it will do. The 5 minute chart is showing lots of wicks and tails on the candles and that is a clear sign to stay out.

The volume will pick up later in the day, and the price action should be more predictable. There is no need to force any trades when volume is low. I use a 10 period moving average on volume on the 1 minute chart to tell me if I should be trading or not. If the average drops below 100 lots per minute at any time between 8am and 11am, then I am better off sitting it out and waiting for better opportunities.
 

Attachments

  • Thurs 7 April 2011 5 min chart.jpg
    Thurs 7 April 2011 5 min chart.jpg
    129.2 KB · Views: 1,785
Last edited:
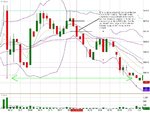
I haven't posted for a few days, but I had to post this morning's chart. This is what I call flip flop price action and it is not easy to trade under normal rules. If you were spreadbetting you would have got killed. There were few established trends and any pullbacks to moving averages were mostly not entry opportunities. The best I can come up with is to use the Boly Bands and sell touches of the high band, and buy the touch of the lower band. Also treat each subsequent candle after the touch as a trend lasting 5 minutes. Set lower price targets of 5 points or possibly less if it starts to stall.

The market is mostly reacting to all the news of soveraign debt problems with Greece and the US. The price action was just breaking up at 9:09am, and literally as a large blocker order was being taken out on the offer, the news came out that the EU believed Greek debt restructuring was unavoidable. This changed the plans for the large traders, and they spent the rest of the morning scrapping around for trades like the rest of us. The resulting price action was just not consistent, and you are better off preserving your capital and sitting it out for something more predictable.

I just mentioned something called a blocker. It is basically a large sell or buy order (usually 300 to 400 lots) , usually set half a point above or below a previous swing high or low. They act like magnets for the price, and almost always get filled. When there is a blocker on the order book, it is worth being aware that most likely the price will end up at that level. Immediately after they are taken out, the price swings back the other way, but not every time. I believe whoever is placing these orders is usually closing a position, but until someone tells me otherwise, I will just watch what happens after they are filled.
 

Attachments

  • Flip Flop Price Action 19 April 2011.JPG
    Flip Flop Price Action 19 April 2011.JPG
    117.6 KB · Views: 832
That looks perfect to me for scalping, and i did ok with CFD's on it this morning....

But then again im only looking for 3 pips a trade and did 10 before 9am
 
Well done Doomberg. Nicely done. At what point did you decide it was a ranging market? And what did you use for a trigger to decide entry? I assume you are getting a one point spread from your CFD provider.

Attached is the one minute chart of the first hour, with the strategy I would use for scalping this market. You would sell within 0.5 point the touch of the upper boly band (12 period setting on the one minute chart) and use 3 or 4 point targets and 3 point stops. If it moved down to the middle boly band, you would then move your stop to breakeven. Similarly, you would buy at 0.5 points above the touch of the lower boly band, and move your stop to breakeven once it moved to the middle boly.

If you used an oscillator like a smoothed stochastic or RSI, your entry may have been too late to get your 3 point profit. But maybe you use a different indicator to time your entry.

As for deciding it was ranging for sure was probably around 8:15am when it had tested both up and down, and also the day before was a big down day and it needed to pause for breath.
 

Attachments

  • Flip Flop Price Action sell-buy bolys 1mc 19 April 2011.JPG
    Flip Flop Price Action sell-buy bolys 1mc 19 April 2011.JPG
    203.9 KB · Views: 1,190
  • Flip Flop Price Action sell-buy stochs 1mc 19 April 2011.JPG
    Flip Flop Price Action sell-buy stochs 1mc 19 April 2011.JPG
    210.1 KB · Views: 840
Would anyone care to explain why the last minute of regular trading produced a volume of 5158 lots traded? Whereas the volume between 9 am and 10 am was 5917, 10am and 11am was 4188, and 11am and 12pm was 4515. I know the last minute is always volatile, but that seems more panic than normal. Usually the FTSE tips its hat as to what direction it will go in the last minute. There is usually a disconnect from the ES. At about 4:05pm the ES was making new highs, whereas the FTSE was not. Showed me there was no appetite for buying and in the closing minutes, 4:25pm to 4:29pm, the FTSE operated on steroids and went in the direction of that that divergence. I went short at 4:23pm at 6044.0, but closed a little too early for 5 points at 4:27pm. Shoulda held on a little longer.

It has been a mincy day with few trends, and more opportunities for range trades than with trend trades. Even the data at 1:30pm was mixed. Roll on the dog days of August!
 
:smart:
Martin C-J
hi
I would like to give this method a try but am not familiar with betfair or how
you do this.
Used to spreadbetting but my brain does not understand the article properly
on how to use beftair.
Please email me at [email protected] if successful would either recompense
you or a charity of yuor choice.
regards Michael

I am doing like you but a whole lot diffrently. I started very humbly with zero confidence in what I was doing about 3 months ago and now I have even quit my accounting job and doing this full time.

To be honest, I think I am doing well. Though my method is a hell lot different from yours. The good thing about my method is that its ZERO LOSS.

To cut a long story short- I do my FTSE100 trades in BETFAIR (these are 20mins FINANCIALS). You will find that its much easier if you download and use the BETTING ASSISTANT(Gruss). This might sound like gambling but am not gambling but making profits EVERY 20 minutes on Betfair Financials. My personal finances are now excellent as a result.

All you do is register with Betfair and download the BA(its only £6/month), and start trading.

Then-log-on to the BA and go to Financials - FTSE-20 minutes.

1) You then bring up the (20mins) just before it goes IN-PLAY, noting the level of the FTSE100 at the bigining of that 20mins. (whether its 5780,5560 or what ever it was just before the start of the 20minutes. These run from 9am to 4pm UK time.

2) Wait for any(whether down or up) to reach its MINIMUM-say @1.20(LAY). Then you take that twice (LAY) at say - one as 1.20@£2 and and the other as 1.20@ £100. NOW NOTE that you only do this when the odds START moving UPWARDS.(CRUCIAL)

3) To safeguard yourself -Place a BACK as 1.20@£102 and leave it UNMATCHED as the odds drift upwards. (this is for just in case the market turns against you.If it does-this CONTRAs your original entries.
Suppose the odds reach 100, you then ClOSE the deal by BACKING as 100@£2. This GREENSUP on both sides at £100 each and at end of the 20 minutes, your account inreases by £100. Then quickly cancel the BACK(security) of 1.20@£102 before it gets matched.

You do this 21 times per day and end of day you bank £2 100 or even more depending on your stakes. The main thing here is you LOSE NO PENNY at all and you make profits every 20 minutes. Sometimes out of the 21 events you might make 12 or more. To me this is good money without having to analyse this and that or lose.

I recently bought a brand new car using this method.
Am sure you can find my email on this forum-hook me up-maybe we can share more about this.

Well I had tried what you are doing before but it gave me so much pressure. I hope this might help.

Cheers
 
Top