Best Thread Algorithmic trading experiences

I'm working on the framework code and educating myself on various techniques like GP, and am not at the stage of developing complete systems.

I agree on the dangers of blindly finding systems with no trading rationale behind them - it's one of the top things to bear in mind and avoid. "Correlation doesn't imply causation". I think of a graph with 2 axes, level of correlation & level of rationale, where you can position trading systems. High correlation, low rationale = curve-fitted system (butter production in Bangladesh predicts the SP500). Low correlation, high rationale = 'proper' trading idea that 'should' work but doesn't ("this market's oversold and P/Es are on the floor, it *must* rise").

Like anything, there are intelligent and unintelligent ways to do this; because many/most people do system development unintelligently, it gets a bad rep.

I agree.

We got our system integrated yesterday at around midday and it racked up $629.15 in profits over 6 long trades & 1 short trade before close out time. That's on a $25k DEMO account with 1% risk per trade - which is spread across a basket of 5 stocks. Obviously it's too early to run with real $$$.

Now to run it for a few months to get the glitches out & tune it. We have some more rules to add in too but the basic system is there.

No conclusions can be drawn from 1 day of trading but it's nice to start off on a high.
 
How's it going so far robster?

You know, I was going to post something last night just to let those interested know where I've got to, so here goes:

I wrote a backtesting facility last week. I identified my most consistent strategy and have been tuning it specifically on when to enter and exit trades. Although my entry was pretty good, my exits were rubbish and eroding the profitability on each trade. Every penny helps.

Also my conservative (safe!) stop losses were also whipping me in and out of the market. So by de-sensitizing these things I have doubled it's profitability by letting the trend be my friend and reduced the number of trades which will obviously affect the net position.

I've been very concious on not trying to fit the curve and have been been sticking to tune what looks like a good strategy which was badly set up by me into something consistent. In short, the back-testing has been invaluable. The forward testing will tell me whether I've got something.

My findings have been quite startling. The most successful strategy has been the simplest one which is triggered by some price action, followed by some checking of moving averages, some support/resistance criteria and then buy/sell.

I've written the money mgmt/risk mgmt bit using a combination of Kelly Formula and measuring volatility per stock to decide trade size but not incorporated that in yet. I'll plug that in once I've back-tested it against what's going on in ftse this week which is nose-diving. I want to see that it protects my capital sufficiently well and stays out of the market when things are bad.

Every thing I think about and code gives me lots of other ideas. Questions like do I monitor the ftse index too and correlate against this? Do I use time-based stop losses if a minimum profitability is not hit within a certain time period (i.e. better money mgmt)?

As a voyage of discovery it has been very intense. I feel like I have learnt more by building, back-testing and forward-testing than I ever could by paper trading or trading a demo account as a fallible, error-prone human being. Even if I end up never using the system for real and end up using something like tradestation, the exercise itself has been immense. I have a real feel for indicator lag and osciallator behaviour. I'm understanding how trading and money-mgmt together really do give you an edge. I understand how this is a numbers game and losses come with the turf. It's how you minimise/manage loss and maximise/harvest the profit. The system you use is a small part of it, important, but only one piece of it.

I'm having a wail of a time.

:D
 
I like the sound of startling findings, especially with a starting point of a simple, sensible strategy. That's the kind of thing holy grails are made of! But seriously, it sounds like it's turning into a good exercise.

I have a real feel for indicator lag and osciallator behaviour. I'm understanding how trading and money-mgmt together really do give you an edge. I understand how this is a numbers game and losses come with the turf. It's how you minimise/manage loss and maximise/harvest the profit. The system you use is a small part of it, important, but only one piece of it.

Dynamite.

Did you get historical data - think you were testing on just a couple of weeks of data before?
 
Did you get historical data - think you were testing on just a couple of weeks of data before?

I can get OHLC data easily. What I can't easily find is historical intraday data so I'm still completely reliant on my own collected data which is now 6 weeks worth.

The strategy is essentially swing trading over a 2-5 day period usually although some positions are open for much longer - hence I need data that goes down to a minimum 5min granularity.

I think when I'm at a point where I'm really happy with the system I'll buy some data. It would be a worthwhile investment imo.
 
Last edited:
I can get OHLC data easily. What I can't easily find is historical intraday data so I'm still completely reliant on my own collected data which is now 6 weeks worth.

The strategy is essentially swing trading over a 2-5 day period usually although some positions are open for much longer - hence I need data that goes down to a minimum 5min granularity.

I think when I'm at a point where I'm really happy with the system I'll buy some data. It would be a worthwhile investment imo.

What data do you want & what format ? Will .cvs do ? If so - I can get you some for free - I'll just pull it off the TS servers.
 
What data do you want & what format ? Will .cvs do ? If so - I can get you some for free - I'll just pull it off the TS servers.

It's a list of 20 UK stocks listed on FTSE. All I need in each row is timestamp, stock code, bid, ask, price taken every 5 mins. It's about 2000 rows per day of trading - it's quite a lot Pedro and it's a big, big favour if you can. I understand if this is just completely out of the question.

Ideally looking for 1/1/08 to 31/12/08 - it's about 500k rows...............:eek:

The period covers ftse when it was behaving normally as well as when it just fell off a cliff and starting swinging up and down violently. It captures the period where the banking problems kicked in and hence gives me a combination of the best and worse possible conditions in that market.

csv is fine, I can mangle it into the db from there.
 
I could actually give you what you want - but 1 drawback - I only subscribe to US data.

Would this work with US stocks or do you specifically need UK data ?
 
I could actually give you what you want - but 1 drawback - I only subscribe to US data.

Would this work with US stocks or do you specifically need UK data ?

I was doing uk stocks just because of familiarity - it should work with any stocks. What I'm looking for is 2008 Dow/FTSE market nosedives after bullish period and volatility afterwards - hence the 1/1/08 to 31/12/08

The only criteria for the stock is that they are liquid stocks in the market that normally trade high volumes. The sectors I've got covered are pharma, mining, banking. retail, aeropsace/defence, engineering, chemical, energy, tobacco, telecommunications - 2 in each category. I've typically picked stocks that are close to the bottom of their 52wk range and have good P/E for their sector.

That would be completely fantastic if you could get this. I can give you ftp access to my server to ftp file across when you are ready.

Tell you what - you do the searching for the specific stocks you want data for & I'll sort you out.

Go to FINVIZ.com - Stock Quotes, Stock Screener and use their stock screener - that'll probably help you to get the list.
 
I was doing uk stocks just because of familiarity - it should work with any stocks. What I'm looking for is 2008 Dow/FTSE market nosedives after bullish period and volatility afterwards - hence the 1/1/08 to 31/12/08

The only criteria for the stock is that they are liquid stocks in the market that normally trade high volumes. The sectors I've got covered are pharma, mining, banking. retail, aeropsace/defence, engineering, chemical, energy, tobacco, telecommunications - 2 in each category. I've typically picked stocks that are close to the bottom of their 52wk range and have good P/E for their sector.

That would be completely fantastic if you could get this. I can give you ftp access to my server to ftp file across when you are ready.

If you can use US stocks, I reckon one of the best technical screeners is

StockFetcher.com - Stock Screening

Not free, but very cheap and way, way better than all the free ones on the web. I think there is some support of sector/industry info, though I haven't looked at it for a while.

On P/E:

I've written my own screener (tech and fund) and done quite a bit of backtesting. I cannot find any edge at all in using P/E as a screening criteria. Except perhaps when looking for shorts where it is wise to avoid high P/Es (as Grey1 recommended).
 
Thanks guys. I'll pick some next week and get back to you. That's a huge help for me. Really appreciate the support.

Interested in the P/E point as well. I thought that having a good P/E would raise desirability in market and therefore influence demand therefore biasing demand/supply dynamic. Intersting to note that it doesn't.

In any event I'm trying to make the system work purely on technical analysis, although my selection fo stocks in the first place implies some fundamental up front.........
 
Interested in the P/E point as well. I thought that having a good P/E would raise desirability in market and therefore influence demand therefore biasing demand/supply dynamic. Intersting to note that it doesn't.

Another way to think about it is that stocks with a low P/E often have experienced a substantial drop in price (which is why their P/E is low). In other words, market sentiment is quite negative towards them. Of course they can bounce substantially, but your timing has got to be spot on or you could be in for a fair bit of grief.

IMHO a very good rule for choosing stocks for swing trading is long strong stocks and short weak stocks. Weak stocks often have low P/Es. You could define "strong" as having better relative strength than the broad market or sector or industry over some period and "weak" as the inverse.

Jim Slater in "Beyond the Zulu Principle" recommends price to cash flow ratio as superior to P/E. He also says it's less easy to fiddle cash flow than earnings.
 
Last edited:
IMHO a very good rule for choosing stocks for swing trading is long strong stocks and short weak stocks. Weak stocks often have low P/Es. You could define "strong" as having better relative strength than the broad market or sector or industry over some period and "weak" as the inverse.

As I've only coded up going long, I'll have a look at the stocks I've picked relative to your criteria and their performance so far - should be interesting to see any correlation between those performing above the sector :)
 
I thought I'd resurrect the original thread as I had a few questions:

1) Modelling price action. I've come to the conclusion this is pointless without actually doing any real trading. Most of my programmed price action is theoretical from books like Murphy (LL, LH, HL, HH, etc) and I get the feeling that it lacks context. I've been reading some threads by Mr Charts and trader_dante and I think I just need to get stuck in and learn first hand. Correct?

2) Short/Long symmetry. Most of my focus has been on going long. I assumed that short would be the same conditions in reverse (i.e. my exit long would be an entry short and vice versa). My short results are dire. Is this normal or does this sound a bit screwy?

3) Ceilings. Last weekend I kind of got to a point with the system that it's got a Win% of about 47% and a risk:reward of about 1:1.9 averaged out over 10 weeks of back-testing. Works out about 4% per month based upon 75 trades over the period. Nothing I've done since seems to make the slightest improvement. It's like the law of diminishing returns. Is it normal to get hacked off with a system that you've spent quite some time on because you feel it's going nowhere fast?

I even created a variable in the code called $doubt this evening.

any wisdom?
 
I thought I'd resurrect the original thread as I had a few questions:

1) Modelling price action. I've come to the conclusion this is pointless without actually doing any real trading. Most of my programmed price action is theoretical from books like Murphy (LL, LH, HL, HH, etc) and I get the feeling that it lacks context. I've been reading some threads by Mr Charts and trader_dante and I think I just need to get stuck in and learn first hand. Correct?

I think that's a good idea. On a SIM account though.

2) Short/Long symmetry. Most of my focus has been on going long. I assumed that short would be the same conditions in reverse (i.e. my exit long would be an entry short and vice versa). My short results are dire. Is this normal or does this sound a bit screwy?

I would say that reversing long & short rules is sensible enough but it depends on what your rules are. Also - are you taking market direction from a higher timeframe & then only going in that direction ? If you run it for October 2008 & your longs are winners & shorts are abysmal, then I'd think there's something amiss.

3) Ceilings. Last weekend I kind of got to a point with the system that it's got a Win% of about 47% and a risk:reward of about 1:1.9 averaged out over 10 weeks of back-testing. Works out about 4% per month based upon 75 trades over the period. Nothing I've done since seems to make the slightest improvement. It's like the law of diminishing returns. Is it normal to get hacked off with a system that you've spent quite some time on because you feel it's going nowhere fast?

4% per month is great ! 7.5 trades a week is not going to kill you on transaction costs. So apart from the fact it's just tested on 10 weeks right now - what's the issue ???

Win ratio is not important on it's own. The difference between the average winners & losers is just as important as is the longest run of losers & drawdown.

In terms of making improvements - it's hard to make suggestions without knowing the specifics but attempts to cut losers short does quite often have as much impact on the winners. You may be better off to try to get the winners to run a bit more. For instance if you just have a profit target right now where you take the whole position off, why not start moving your stop loss to that area & start trailing it - then start getting more aggressive with your stop loss in say the last 45 minutes of the trading day.

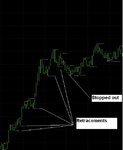
Personally, i like the idea of setting stop losses on each retracement:

attachment.php


After all - once you start to make lower lows on an long trade, it's time to think about getting out.
 

Attachments

  • retracements.JPG
    retracements.JPG
    32.4 KB · Views: 1,485
Hi,

wrt to the short problem, I had a good look at it last night after I'd posted but before I went to bed. nothing like stimulating your brain further before trying to get to sleep.
I have coded up something which monitors the trend of ftse100. without going into dull details the basic premise is that if it's going up, then it will allow going long. If it's trending down then it will allow going short. Basically don't trade against the prevailing trend of the index - safe. I think what it's doing for short is shaking me out as retracements are more aggresive from what I can see. Falls seem to happen more quickly, retracements more sharply. I think it needs to be less sensitive to fluctuations when going short than it is when going long. Like a sawtooth wave.

wrt to the long ceiling. Average win is £69, average lose is £32ish from memory (not near the machine at the moment). The system now has trailing stop losses to lock in profit which made a big difference to the performance. The trailing SL is not based upon retracement levels though , more arithmetic based upon the original SL.

The main basis for the strategy is:

1) FTSE100 direction
2) Basic price action (LL, LH, HL, HH)
3) Trend crossover
4) Confirmation of establishment of trend (longetivity and gradient)
5) Stock specific volatility index

It has resonance with this post from Mr Charts -

http://www.trade2win.com/boards/us-stocks/38036-how-make-money-trading-markets.html#post493742

Strongly establish that a trend is in operation then in. So in theory the strategy is quite laggy as a consequence of being sure a trend is established/finished but the Win% was telling me that maybe it's not that good.

I've also not considered having a profit target. The strategy basically comes out after the bend, it establishes that a bend really has happened. Maybe working on a retracement based TSL strategy rather than arithmetic and figuring out ways of exiting earlier on the wins might be a better approach as you're suggesting.

In the cold light of day (I'd had a couple of beers last night, long couple of weeks, lots of travelling around Europe, early starts, late nights, needed a kick back) 4% per month isn't bad for my first attempt.

I've still not back tested against the S&P data you sent - I'm still noodling with my ftse based data. Feels like the noodling never ends.

cheers

rob
 
Last edited:
volatility stops are the best kind of stops imo. i use atr x2 for my stop and atr x3 for my target.
my systems expectancy is only 0.29cents per $1 risked but because of frequency i can achieve a return of 200% per year. People try too hard to optimize because they cannot stand a system with drawdowns or that only wins 35% of the time as its in our human nature, but if you postion size correctly with management model you should come on top and infact these kind of models imo are the best.

I think you should build a model that has postive expectancy on its fixed target and stop alone, then look at individual trade drawdown data and optimize from there. I had 7 advanced exit startegies with my code and ive disabled many of them as code actually performs better without any of them as many times exits would take you out of a target hitting trade, so or though my stops were tighter my overall profit was much less.

i like the idea of a trailing atr stop that updates and keeps to atr multiple each time a new high or low in the current trade happens.

I thought about building a scalping type system (which is what I think you have) but when I prototyped I found that the number of trades and therefore the commissions made it prohibitive. How have you got around this (unless I've missed your point)? Are you essentially trading less frequently but looking for a 1:1.29 ratio and position sizing to make a good return based upon a high probability of hitting 3 x ATR?
 
I thought about building a scalping type system (which is what I think you have) but when I prototyped I found that the number of trades and therefore the commissions made it prohibitive. How have you got around this (unless I've missed your point)? Are you essentially trading less frequently but looking for a 1:1.29 ratio and position sizing to make a good return based upon a high probability of hitting 3 x ATR?

If you average win is £69, average lose is £32ish then you do have a scalping system.

I think you need to look at a minimum of 2 timeframes, use the higher 1 for direction & the lower one to trade in.

When you consider trends - also consider the timeframe. The market may be trending in the 5 min time frame but be cyclic/choppy in the 60 min time frame. In fact, a cycle reversal in a higher time frame is going to be a trend in a lower timeframe.

Nuff said...
 
Top