charcoalstick
Junior member
- Messages
- 39
- Likes
- 1
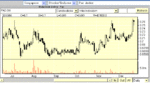
dbphoenix said:Which brings us to the third chart, which includes the time period you're interested in. In context, one can see that there is clearly something going on with that first spike that has nothing to do with accumulation. There may have been news of some sort. Or rumor. Something. But whatever buying interest there was was purely momentary; there wasn't nearly enough to sustain an upmove.
Db
A breakout from accumulation that is spiked up in terms of price and volume is most likely unsustainable for a substantiable markup phase?
Is that any signature breakout pattern that are most favourable for a sustained run?
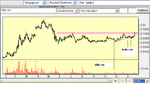
dbphoenix said:TrAc does decline, but there is no pullback in price. Price instead just hangs there in limbo. There is insufficient buying interest to push it farther (if there were, price would rise). But there is also insufficient selling pressure to push it down. At least for the time being. Finally, five bars later, there is a spike in TrAc and price closes near its low, not a good sign. On the other hand, price hits the S established in early September with no significant increase in selling pressure (if there were, TrAc would be higher). In other words, sellers, for now, are done.
Db
In the period when the price just hang there in limbo, is that any signal from market which way it is going?
On a close look, there seem a V shaped pattern in price and volume during this period. As the trading activity increase, the price try to rise from the V shaped but always kind of selldown from 1.62 resistance ( doji and subsequent black candle). -> Can I interpret this as a warning signal?
any comment?
This is not my trading vehicle. I m vested in her subsidary pacific andes, Pad.SG listed in singapore, based on FA. So sometimes I looked at the hk chart as reference.
Any comment of singapore listed pad.sg chart? Have been sleeping despite the surrounding bullish sentiment. Wonder whether this is healthy?


