a DOW thread for traders of the DOW

What is wrong with you ?You had these trades called in advance ................days in advance .....you had same chance to put on those same trades by copying them.You did not.Check the thread history.:LOL::LOL:

i can take 100 pts out the dow every single day, i don't need your trades. thats why i didn't take any :cheesy:

what i need is the ability to ramp my contracts to 5 or 10, because right now after 2 it affects my judgement and hurts my performance.
 
Last edited:
i can take 100 pts out the dow every single day, i don't .
excellent mate.so i take it that you are not revenge shorting 3 positions and going 300 points offside like you did last time.:cheesy:
tumblr_nv75eoKYRa1s9ab4to1_400.gif
 
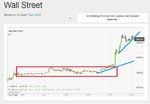
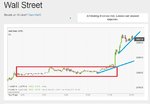
Here is the "apparent" situation - the circled area is a move up in holiday season, take a look at the upside volume - nothing there, so this price was driven up with ease by those that "can". We then sell down from a higher price to bring in shorts the next 2 days and also probe the daily low - stops for these guys will be back above the range (20700 on the chart). By this time a big double bottom is in play and joe public jumps back in long again and the powers that be say "Thank you very much". We then run out of buyers, and fall over to correct over the next few months.

That's whats going on - the timing is up to you!

But the 550 mentioned wont be far off, but always let price action confirm the halt - no need to be a hero with so many pts on offer!

Looks like we are up here already (breaking above the range) , now we see how many buyers come in, then its gonna get kind of shakey in here me thinks!
 

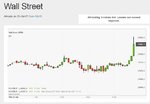
Ok you got in 20520, i can see a long wick on 5 min chart hitting that price area, was that you entry or was it price alone and the price level your entry?

Today I had a terrible day, couldn't find anything to trade, ended up going short on such a bullish day. still in trade seeing if I can at least break even.

Will look for levels to go long on DOW

I am sorry ,it is difficult to time themarkets.

My latest trade on DOW is here

http://www.trade2win.com/boards/tra...ychologically-correct-trades.html#post2897546
 
Dow is long at 60 stop below 20720 , but i don't gamble like 40 pip lotter ticket holders.I wait for pull back.
 

Attachments

  • dow.jpg
    dow.jpg
    34.3 KB · Views: 168
Dow is long at 60 stop below 20720 , but i don't gamble like 40 pip lotter ticket holders.I wait for pull back.

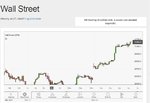
Ok my previous level of support for DOW never hit. I am going to try and go with the trend. Its hard for me to identify the trend here but I would say its a bullish market based on all the sessions since 17 Apr trading above 20409, so seems like bulls are keeping it up/pushing it up.

I will look on the 1hr chart for price action to go long, like buying a dip, ideally a candle bar with a long wick showing bulls pushed it back up.

Also I noticed 20780 looked like previous support, if it breaks here and comes back down for a dip ill buy 20780.

I'm still learning, lets see if I am right

p.s. not trying to time the market , trying to go with trend, identify levels where it will be a good price to get in (going with that trend) and want to wait for price action to confirm my trade, so only go long if candle bars shows bulls pushing up e.g. long wick on bottom of candle bar
 

Attachments

  • DOW daily.png
    DOW daily.png
    85.9 KB · Views: 174
Ok my previous level of support for DOW never hit. I am going to try and go with the trend. Its hard for me to identify the trend here but I would say its a bullish market based on all the sessions since 17 Apr trading above 20409, so seems like bulls are keeping it up/pushing it up.

I will look on the 1hr chart for price action to go long, like buying a dip, ideally a candle bar with a long wick showing bulls pushed it back up.

Also I noticed 20780 looked like previous support, if it breaks here and comes back down for a dip ill buy 20780.

I'm still learning, lets see if I am right

p.s. not trying to time the market , trying to go with trend, identify levels where it will be a good price to get in (going with that trend) and want to wait for price action to confirm my trade, so only go long if candle bars shows bulls pushing up e.g. long wick on bottom of candle bar

The problem is that what we see as a trend might actually be a route down a wrong way street. Looking for a wick can actually show weakness in trend ( think about what has happened in the total candle). This is a dangerous area to play any longs long term. You will be buying into major players hands. Won't go into detail as I have already shown a chart in this thread. As you have mentioned wanting to wait for the best opportunities, you will need to consider which side you want to be on and where you ultimately gauge it will go.

Remember a wick will not always be seen on another time frame, so what is it about the wick that is really important? What if it has been created as a result of big players supporting price so they can distribute on the next push up ? Then you will buy into their selling only for price to then correct on you. See how wicks are not so straight forward?

Not easy.


Yes I see what you mean. Was just saying I need to look for something to confirm my price .

Either that or I just go on price alone at what I have identified as sup/res levels.

I don't know I have the margin to hit the trigger at price alone and watch it offside before it comes in etc
 
i call this

raaaaaaaaaaaaaaaaaaaaaaaaaaaaaaaaaaaamp!

it's a beautiful thing:D
 
Bought 20998 cash , and put 20950 for 47 , expiry friday

I went for wrong instrument dax .

http://www.trade2win.com/boards/trading-journals/223330-hindsight-dax-lulz.html#post2898020

Timing the entry is the strategy of making buy or sell decisions of financial assets (often stocks) by attempting to catch the optimum trend breakout. The entry may be based on technical or fundamental analysis.

Here I been sitting on this trade for hours , hardly any move .Sometimes it wiill do nothing for days , it may breakdown and move later without me.
 
I'm still learning, lets see if I am right

p.s. not trying to time the market , trying to go with trend, identify levels where it will be a good price to get in (going with that trend) and want to wait for price action to confirm my trade, so only go long if candle bars shows bulls pushing up e.g. long wick on bottom of candle bar

Timing the entry is the strategy of making buy or sell decisions of financial assets (often stocks) by attempting to catch the optimum trend breakout. The entry may be based on technical or fundamental analysis.

Here I been sitting on this trade for hours , hardly any move .Sometimes it wiill do nothing for days , it may breakdown and move later without me.
 
Top