Mathemagician
Established member
- Messages
- 603
- Likes
- 130
You might consider re-evaluating your estimation of the significance of a 50 day moving average crossing over a 200 day moving average.
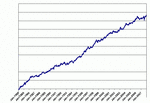
Here is a plot of the equity curve produced by trading a 50/200 MA Crossover both long and short on a properly constructed portfolio of futures markets with appropriate risk management. It's a 21% return (zero riskless) with a 28% maximum drawdown over a ~25 year period.
jj
Here is a plot of the equity curve produced by trading a 50/200 MA Crossover both long and short on a properly constructed portfolio of futures markets with appropriate risk management. It's a 21% return (zero riskless) with a 28% maximum drawdown over a ~25 year period.
jj

