1-2-3-Formations and Ross Hooks

Invisible hooks - for educational purposes only

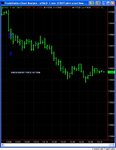
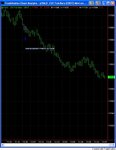
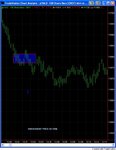
This is added for educational purposes to supplement, not refute, the posts on RH in this thread. For those who are wondering or studying what happens internally ‘inside’ an RH, the first attached jpg illustrates, in terms of aggressive volume, an ‘invisible’ hook . While actual ‘by the book’ hooks showed up later, this ‘invisible’ one followed a forceful directional bar. ie imo quality RH’s don’t just happen anywhere, but where momentum is at increased levels. Then, in this ‘invisible’ hook, increased aggressive buying AND aggressive selling occurred (price action inside rectangle shown on invisible hook .jpg) with the odds ( by Joe) of course favoring continuation of the thrust. Subsequent price action shows (on bar chart shown on SubsequentPriceAction.jpg) that position taken on this hook took little heat (and btw has broken down out of more ‘hooks’ by another 20-30 ticks since picture was taken). Hopefully, this will give us some clues about what the 'auction' is doing during the formation of a hook and help ferret out the best setups.
 

Attachments

  • Invisible RH.jpg
    Invisible RH.jpg
    70.8 KB · Views: 738
  • subsequentPriceAction.jpg
    subsequentPriceAction.jpg
    60.9 KB · Views: 682
ZDO said:
This is added for educational purposes to supplement, not refute, the posts on RH in this thread. For those who are wondering or studying what happens internally ‘inside’ an RH, the first attached jpg illustrates, in terms of aggressive volume, an ‘invisible’ hook . While actual ‘by the book’ hooks showed up later, this ‘invisible’ one followed a forceful directional bar. ie imo quality RH’s don’t just happen anywhere, but where momentum is at increased levels. Then, in this ‘invisible’ hook, increased aggressive buying AND aggressive selling occurred (price action inside rectangle shown on invisible hook .jpg) with the odds ( by Joe) of course favoring continuation of the thrust. Subsequent price action shows (on bar chart shown on SubsequentPriceAction.jpg) that position taken on this hook took little heat (and btw has broken down out of more ‘hooks’ by another 20-30 ticks since picture was taken). Hopefully, this will give us some clues about what the 'auction' is doing during the formation of a hook and help ferret out the best setups.

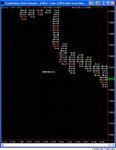
The "invisibility" may be due in part to the method of display. Try a volume bar display rather than time intervals and you'll have a more graphic display in bar form, the cascade of selling followed by your "hook" during 1201-1202. Time bars cloak quite a lot.
 
For educational purposes only

dbphoenix said:
The "invisibility" may be due in part to the method of display. Try a volume bar display rather than time intervals and you'll have a more graphic display in bar form, the cascade of selling followed by your "hook" during 1201-1202. Time bars cloak quite a lot.


db,

You may be missing the point. The point is to explore the ‘auction’ behaviors behind / setting up quality RH’s. Quality RH’s are set apart by strong, aggressive jumping the bid AND jumping the ask that coils up a tiny (and ‘by the book’ inside) bar. On all types of bar charts, they just look like a ‘pause’. My point is that the good ones have preponderance of aggressive volume. This particular ‘hook’ was only visible on the modified MarketDeltaFootprint chart. We can try any chart style we like. It remained ‘invisible’ / non existent / cloaked on normal time bar AND volume AND tick chart interval styles, but the ‘auction’ action that makes a great hook was there, whether it's lucky enough to print a ‘by the book’ RH or not. See attached tick chart same time period.

zdo
 

Attachments

  • SubsequentPriceAction233Tick.jpg
    SubsequentPriceAction233Tick.jpg
    59.3 KB · Views: 566
It's may be true that I'm missing your point, but the hook was not invisible with volume bars. And the "aggressive" nature of the volume is also evident with volume bars. A chart which consolidates the ticks into 233-tick bars won't -- in this case -- show your hook, either. A 1-tick chart would, but then you wouldn't be including volume.
 
For educational purposes only

dbphoenix said:
It's may be true that I'm missing your point, but the hook was not invisible with volume bars. And the "aggressive" nature of the volume is also evident with volume bars. A chart which consolidates the ticks into 233-tick bars won't -- in this case -- show your hook, either. A 1-tick chart would, but then you wouldn't be including volume.

It doesn’t matter what type of chart is used. All of them can ‘cloak’. (see attached Volume chart). All of them are only representations of an auction. ie “The map is not the thing mapped.” Not trying to ‘show’ a hook or reveal ‘hidden’ ones. Am trying to explore and share what happens inside a quality hook (in spite of your shoot first and ask ?’s later dilutions :) ). Not exploring the absolute quantity of volume. Not factoring in any price (or time) SR at that time. Only looking at the rapidly oscillating imbalance of volume that is important here – the ‘balance of imbalances’ if you will, that creates a quality hook (illustrated in the first attachment). These ‘balance of imbalances’ may or may not manifest on one’s chosen chart style and timeframe – that’s not the point.

Taking every hook will produce a ‘wash’ at best – just like taking every moving avg setup, or every 123 setup or SR setup or … Review the posts on RH in this thread. Many of them have EVERY hook marked as a setup. Discussion in the most recent posts was about time frames and taking (or not) all the hooks, etc. However, in his early books, Joe Ross explicitly counseled traders to learn how to discriminate and not go hook and 123 happy. With sufficient screen time, motivation, and belief that RH’s should be taken discriminately; one can learn to take only the good ones on any chart type… and if readers are into learning that – I am making these suggestions. The first crit of the setup is a new spurt of momentum just previous to the hook. And while most hooks are balanced tiny pauses / corrections, quality hooks have a more significant ‘balance of imbalances’ going on inside them that end the ‘bar’ in a stalemate that action in subsequent bars breaks. (see rectangle in first attachment)
 

Attachments

  • SubsequentPriceActionVolumeBars.jpg
    SubsequentPriceActionVolumeBars.jpg
    62 KB · Views: 517
Not sure what you mean by "shoot first and ask ?’s later dilutions", but you seem not to understand my point, either. No matter. If your choice of display works for you, that's great.

Db
 
“Dilutions” = talk about this kind of chart, that kind of chart.
Representations of the market in this context are superfluous. It doesn’t matter about what bar types are showing this or that. The ‘auction action’ behind any of the representations we may ‘draw on’ is what I was attempting to get the reader to explore for RH’s. A serendipitous example just happened to show up in the MDF bar type and I used it. Maybe if I had just used words instead of words and pictures you wouldn’t have come up spraying cover fire for something …
You are welcomed and encouraged to discuss the context but please no more about representations / chart types. The painful, #)(%(^@ truth is that none of our representations approach doing what we would really want them to do…
 
ZDO said:
“Dilutions” = talk about this kind of chart, that kind of chart.
Representations of the market in this context are superfluous. It doesn’t matter about what bar types are showing this or that. The ‘auction action’ behind any of the representations we may ‘draw on’ is what I was attempting to get the reader to explore for RH’s. A serendipitous example just happened to show up in the MDF bar type and I used it. Maybe if I had just used words instead of words and pictures you wouldn’t have come up spraying cover fire for something …
You are welcomed and encouraged to discuss the context but please no more about representations / chart types. The painful, #)(%(^@ truth is that none of our representations approach doing what we would really want them to do…

I agreed with you at the beginning of the thread about context and have posted to the thread only a couple of times due to the fact that so little attention is paid to it. I have no idea what you mean by "cover fire".

In any case, the text you posted in your first jpg is also a representation. Whether it's in chart form or not is not especially pertinent. I'm merely pointing out that whether the "hook" is "invisible" or not depends on how you elect to display the data.
 
Where exactly is the hook?

To ZDO: Thank you for sharing your insights!
Can you please denote on any of the charts you posted the hook you are talking about - was it the invisible one which is hidden under one bar or the one that followed your "auction action"?

And what was your conclusion/judgement on that RH - was it worth trading it or not? I guess you called it "quality hook" meaning "yes". But it didn't look great to enter in there as some sort of congestion followed it for a while. It was much better to enter a little later in my view (unless we were already in there from the start).

Am I missing the point completely?
 
Happy Trading

Hello Friends,

I came to know about your Forum while going through One of the Threads (1-2-3- Formations and Ross Hooks) at Forex Factory Forum. To know and understand the subject in depth, I decided to visit your 'Learned Forum' and here I am. Basically, I trade in Futures and am a good learner to improve my trading. I hope to pick and learn a few things over here also and in due course of time shall be willing to share my experiences with you all.

Thanks.
OMSAI:clap:
(May God be with you)
 
Trading the 123 on the 1 minutes-nightmare!!

Hi all,

I'd just like to introduce a bit of feedback from trading the 123 on 1 minute time frames on the FTSE. I've traded it in the month of January and came out in the green using a combination of the 123 and what I called "mini flags". In the end I had to abandon it out of frustration really.
This pattern, although it occurs frequently fails so often that it becomes very frustrating. When you have a 123 failure, Ross recommends reversing the trade but that too can be pretty tricky. I think you've got to be very cool-minded to trade this pattern on a 1 min time frame. It's very, very good to use as an indicator though; very often, the 1-2 leg will equate the size of the 3-exit leg. This gives you an idea of where to expect a turning point and where not to buy/sell. I've also found that a good place to buy or sell after these turning points is below or at the 10 or 20 day EMA.
Having read Ross on intraday trading and trading the dailies, it seems that he much preferred trading this pattern off the dailies rather than the intraday charts.
I really don't think the 123 is very good at all to trade on the one minute. Has anyone traded it successfully on the dailies? If so, how many bars do you use to define your setup and what markets do you trade it on? Does anyone know what the expectancy of this pattern is and have they back-tested it?

Get in touch with Barjon. He started a thread called "Swingin' FT2008" or similar on the UK Indices platform.
 
Hi Guys

I am new to this method and would love to know more abt it....any suggestion?
 
Along with this method check out "trading bar by bar" by Al Brooks, takes price action trading to a different level than Ross
 
I have the book called Trading Bar by Bar.

It should, however, be called Trading Candle by Candle.
 
Tick charts are also good for seeing stuff you can't see with a time chart.

JR
Hi Joe
Can you tell me the number for best tick charts that you use ?
I have used 2000 and 4000 tic charts in the past, with some positive results.

Thank You in advance,
Edna
 
Top