1-2-3-Formations and Ross Hooks

Most interesting and promising thread, Roberto. Well done and thank you.

I will be a regular reader and probably occasional contributor. As you know, I've been trading 1-2-3-formations and Ross-hooks and little else for many years now. (Will I get shot down for trying to introduce the Ross "Camelback Technique" here? I think you don't like indicators? I'll wait a while anyway.)

The comments about the confusion in nomenclature surprised me. I've always perceived them the way round you originally described them in your initial post. However, a look around the internet (I no longer have my copies of the Ross books here!) has just shown me that that ain't necessarily so. Different people describe Ross-hooks and Reverse Ross-hooks in some diametrically opposite ways! None of this is of any practical consequence at all, of course, but it will help with the discussion if everyone is singing from the same song sheet, so it would be great if you could maybe post a formal definition from the Original Source as you mentioned.

I'm looking forward to the discussion of what actually causes these formations, what the markets are doing, how the buying and selling pressures are interacting and producing these trading opportunities from which some of us make a living.

More power to your elbow.

David
 
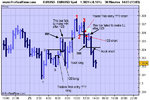
Many thanks for the very tactful corrections, guys. Jim and Skog are entirely right, of course. I've had a look in "Trading The Ross Hook" and realised that I mis-labelled my chart and mis-described the situation in my rush to post this afternoon - confusion between "Ross Hook" and "Reverse Ross Hook". (Lucky for me that the trade concerned was from a 1-2-3-formation and not from a Ross Hook so that at least I didn't mislead anyone about the trade!). It will indeed be easier if we all sing from the same song-sheet.

I won't go back and edit/correct now because it will make a nonsense of some of the above comments; I'll just take more care in future.

So, a definition ...

A Ross Hook is the first failure by prices to make a higher high subsequent to the breakout of a 1-2-3-low formation (or a lower low subsequent to the breakout of a 1-2-3-high formation), or the first failure by prices to make a higher high subsequent to the upside breakout (or a lower low subsequent to the downside breakout) of any type of consolidation area, e.g. ledge, congestion or trading range.

dr_d_michaelson said:
I think you don't like indicators?
Not at all, David: some of my best friends are indicators.

Joe Ross says that he himself prefers trading the 1-2-3-formations and Ross Hooks without using any indicators at all, but he does also include in his books a selection of indicator-based filter systems for them, all of which are perfectly valid and profitable, some of which we might come to in due course. I thought I might post some more accurately labelled charts first, which I'll get round to romorrow when I'm more awake. :)

dr_d_michaelson said:
I'm looking forward to the discussion of what actually causes these formations, what the markets are doing, how the buying and selling pressures are interacting and producing these trading opportunities
Me too. Will post some more tomorrow.

I feel I really ought to mention, not least because Joe has kindly written an article for the Knowledge Lab section here recently, and because I've taken the liberty of quoting from one of his books and probably will do so again at some point in this thread, that they're available from the t2w online shop, and that I unreservedly recommend them.
 
So, a definition ...

A Ross Hook is the first failure by prices to make a higher high subsequent to the breakout of a 1-2-3-low formation (or a lower low subsequent to the breakout of a 1-2-3-high formation), or the first failure by prices to make a higher high subsequent to the upside breakout (or a lower low subsequent to the downside breakout) of any type of consolidation area, e.g. ledge, congestion or trading range.

I take it the actual Ross Hook 'bar' (after all the hook is strictly a formation) is the bar preceding the failure bar? If so I've just understood them at last - thank you :) :)
 
Please tell me I'm close now LOL :D
 

Attachments

  • untitled.jpg
    untitled.jpg
    192.1 KB · Views: 4,772
Yes, absolutely. And thanks very much for clarifying my earlier chart. :)

(By the way, your "TTE" shown after the second 1-2-3-formation was exactly where I entered my trade today.)
 
hang on a trick. I thought the traders trick entry was on the high of the failure bar that created the ross hook?
 
Those patterns and similarities are so well known that many scalpers will anticipate them knowing where others will enter.Here is something similar from the Dow tracking stock last night and the anticipation of what will happen.Its not to say they wont work but in my opinion there is more profit in anticipating them than playing them.
 

Attachments

  • a1.gif
    a1.gif
    12 KB · Views: 1,747
  • a2.gif
    a2.gif
    13.5 KB · Views: 1,846
  • a2a.gif
    a2a.gif
    17 KB · Views: 2,125
  • a2b.gif
    a2b.gif
    12.3 KB · Views: 1,845
barjon said:
hang on a trick. I thought the traders trick entry was on the high of the failure bar that created the ross hook?

From the book, for the case of a Ross Hook in an uptrend:

"As prices approach the high point of a Ross Hook, we buy a breakout of a high that was on either side of the hook. We want to select the bar closest to the high that still leaves enough room to cover costs. That way, if all we get is a double top, or a false breakout,we will at least have traded for free, having covered our immediate overhead".

My own take on this is that picking a precise high is a bit of a pedantic approach especially if on an intraday chart, but it makes sense to me just to get in a little bit early in anticipation that the hook itself will act as a short term magnet to enough people to make the move likely to that point at least.
 
Hi Naz -

Thanks for the charts. To confirm were these attached to prove that price will often not come back to most recent low?

I am only confused as they do seem to illustrate a 1-2-3 reversal.

Thanks
 
Naz has posted up some nice 1 minute charts above.

I am not sure at this stage of my trading career that I would take up his suggestion of anticipating these formations rather than playing them, but I am happy to concentrate on early trade entries rather than the standard text-book entry point.

I would be interested to hear from other intra-day traders who play these formations, what chart time frame do they find most effective in identifying and trading these 1-2-3 formations.

1minute, 3 minute, 5 minute, 10 minute charts... ?
 
I find 15-minute and 30-minute charts best for me. I don't want positions that might stay open overnight, but I want a reasonable number of trades within the day to try to even out the variability. These things can be found even on 1-minute charts, but I suspect that the spread would be too prohibitive to make consistent profits fron trading them that way.

I think that the criteria for "identifying" them and for "trading" them might conflict, in short. You find more of them on faster charts, but they're harder to trade. All IMHO, of course.
 
Naz said:
Those patterns and similarities are so well known that many scalpers will anticipate them knowing where others will enter.Here is something similar from the Dow tracking stock last night and the anticipation of what will happen.Its not to say they wont work but in my opinion there is more profit in anticipating them than playing them.
Ok Naz, I know it's against the "magician's rules" for you to tell how you did it, but when you pulled that rabbit out of the hat, were you looking at:

  1. price action only
  2. level II orders
  3. recorded volume
  4. a longer term chart that showed support there
  5. something not mentioned in this list
  6. some kind of combination of these?
JO
 
Last edited:
I'm also a fan of Joe Ross and ''his'' 1-2-3's, Ross Hooks etc - I have his books ''Trading by the Book'' (which is excellent) and ''Trading the Ross Hook'' (which frankly isn't)

I'd like to add a brief comment regarding time-frame. I have noticed that when a TTE, RH or 1-2-3 signal fails in one time-frame it's often possible to switch up/down a time-frame (or two) to keep the set-up alive.

Some of these 'secondary' set-ups do prove profitable which only encourages further adjusting of the time-frame once a signal on your original chart fails. However this goes against all the 'learned' instincts about filtering indicators/set-ups to suit YOUR determination for a profitable trade rather than cutting losses and moving on.

Do any JR fans have anything to add? Is there any logical time to take the secondary signal?

Tks in advance for any comments
 
Trading by the minute

I am considering purhcasing Trading by the Minute by Joe Ross.
Has anyone here read the book?
Would you recommend it for intraday trading?

Do you know of any other good books with regards to intra-day trading?

Thanks

I.T
 
Barjon/Jim,

You are both right about the TTE.

The TTEs marked on my chart are something different (FTEs perhaps :), although they are also designed to anticipate a breakout.
 
Indextrader100 said:
I am considering purhcasing Trading by the Minute by Joe Ross.
Has anyone here read the book?
Guilty.

Indextrader100 said:
Would you recommend it for intraday trading?
If you're looking for this sort of intraday trading, then definitely. My only reservation about it is that it was written more or less a sequel to "Trading By The Book" which in theory one should read first. However, in practice, I believe that enough of that book is probably now available free online, one way and another, for it not to be the end of the world if you don't.

Parts of "Trading By The Minute" are drawn from the author's experience of trading the S&P from 5-minute charts, which I'm guessing from your name will interest you.

Indextrader100 said:
Do you know of any other good books with regards to intra-day trading?
I don't really. There are certainly some "general trading books" which are applicable to intraday trading, but I think that's probably not what you're asking about?
 
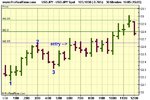
Just posting another 1-2-3-trade chart while it's to hand.

USD/JPY. 2-point was at 102.64. Entry at 102.65 on 6.00 bar. Took profit of 15 pips on one third of the position at 102.80 on the 10.00 bar, and moved the stop-loss on the remaining two-thirds to break-even. Took profit of 30 pips at 102.95 on the next third of the position, and moved the stop-loss on the remaining third to 102.80 on the 11.30 bar, intending optimistically to let the last third run with a trailing stop. Sadly got stopped out on the last third as usual (but still with 15 pips profit on it) on the following bar. Average of +20 pips. (Original stop-loss apparently not shown on this chart, sorry).
 

Attachments

  • USD-JPY.JPG
    USD-JPY.JPG
    48.9 KB · Views: 1,968
Roberto said:
Just posting another 1-2-3-trade chart while it's to hand.

USD/JPY. 2-point was at 102.64. Entry at 102.65 on 6.00 bar. Took profit of 15 pips on one third of the position at 102.80 on the 10.00 bar, and moved the stop-loss on the remaining two-thirds to break-even. Took profit of 30 pips at 102.95 on the next third of the position, and moved the stop-loss on the remaining third to 102.80 on the 11.30 bar, intending optimistically to let the last third run with a trailing stop. Sadly got stopped out on the last third as usual (but still with 15 pips profit on it) on the following bar. Average of +20 pips. (Original stop-loss apparently not shown on this chart, sorry).

Roberto

good trade.

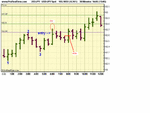
I'm reading things slightly differently? Can you confirm or correct my impression that after a down move (creating 1) there is a rise (creating2) then a fall stopping short of 1 (creating 3) and that the ross hook comes after 2 is taken out and then a (or up to 3) failure bars. TTE is when the high of the last failure bar is taken out?

Sorry if I'm being obtuse - got to dash pick it up later

good trading

jon
 

Attachments

  • rosshook.gif
    rosshook.gif
    52 KB · Views: 1,707
At the risk of jumping in on someone elses conversation, I believe you have read that correctly barjon according to joe ross's rules.

I sometimes take an entry off the bar that "confirms" point 3 of the 123. It's a more aggressive entry but on the chart, the confirmation bar would be the 5 am bar, the one after that marked as point 3 on the usd/jpy chart. I call it a confirmation bar as it has made a higher low and higher high than the point 3 bar. As I say, this is a more aggressive entry and the first target would be point 2 of the 123 formation. This is a kind of traders trick entry which I currently use with a 3 lot position. 1st scale out being point 2.
 
Top