How To Trade: Full Stop

Status
Not open for further replies.

The Expert

Established member
Messages
618
Likes
18
As my debut was not welcomed by some, maybe I can find some real aspiring traders here that want to discuss some realities of trading. I promise not to delete any posts made to my thread, no matter what they are. It is hard for any person to learn if they are not given all the information, even if some of it is not good.

Feel free to ask what you want and I will try me best to give you an honest answer, to the best of my knowledge. If you want a chart analyzed then post it and we will see if we can make some sense out of it. No jokers or time wasters, please. Please note that I speak straight and no bs, so be prepared for an answer that you may not get from others.
 
It has to be said, it would probably help to know the specific area of expertise before fielding questions.

But - your starter for 5 - back up to the end Dec highs or back on down ?
 
As my debut was not welcomed by some, maybe I can find some real aspiring traders here that want to discuss some realities of trading. I promise not to delete any posts made to my thread, no matter what they are. It is hard for any person to learn if they are not given all the information, even if some of it is not good.

Feel free to ask what you want and I will try me best to give you an honest answer, to the best of my knowledge. If you want a chart analyzed then post it and we will see if we can make some sense out of it. No jokers or time wasters, please. Please note that I speak straight and no bs, so be prepared for an answer that you may not get from others.

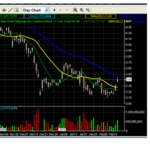
Ok lets see what u got... Can u analyse this daily chart of C for me?
 

Attachments

  • C Daily.png
    C Daily.png
    115.9 KB · Views: 932
I like the gap up on good volume..while the chart might look like resistance and a sell to most technical analysts (i see you have drawn a res line) I would be long this in the short term.
my view only ofcourse!
 
no idea timsk, also the 28-1-10 is missing..... hey got to love your software :)

I am sure these little faults wont effect The Experts analysis
 
I like the gap up on good volume..while the chart might look like resistance and a sell to most technical analysts (i see you have drawn a res line) I would be long this in the short term.
my view only ofcourse!

I havent drawn any lines on this chart. The green line u see is the previous days close.
 
OK - I have a SERIOUS question.

NASDAQ : AVGO
Company Name : AVAGO TECHNOLOGIES LTD
Status : Priced (8/6/2009)
Proposed Symbol : AVGO
Exchange : Nasdaq National Market
Share Price : $15.00
Shares Offered : 43,200,000
Offer Amount : $648,000,000
Total Expenses : $6,100,000
Shares Over Alloted : 0
Shareholder Shares Offered : 21,700,000
Shares Outstanding : 235,888,203
Lockup Period (days) : 180
Lockup Expiration : 2/2/2010
Quiet Period Expiration : 8/31/2009

As it says - shares put out to the public 43 Million. That was the float. There's almost 200 million shares not on the market prior to the lockup period which expired on 2/2/10.

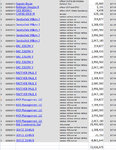
On 2/2/10 the lockup period expired and the following insider sales took place:

attachment.php


So - that's a stock with a float of 43 million & insider selling of an additional 73 million on 2/2/2010.

On the other hand - here's the chart.

attachment.php


Questions
- where's the sale of 72 million shares by the insiders?
- why didn't trebling the float cause the share price to drop?

Many thanks

DT
 

Attachments

  • AVGO2-Feb-10.jpg
    AVGO2-Feb-10.jpg
    331 KB · Views: 3,038
  • AVGOChart.jpg
    AVGOChart.jpg
    63.8 KB · Views: 3,778
Last edited:
Ok lets see what u got... Can u analyse this daily chart of C for me?

If you can make the image a bit bigger I might be able to see some detail. Please post links to full images with high resolution, as anything else is just unprofessional. As I mentioned at the start, no jokers or time waster's please, and that goes for all.
 
attachment.php


First Lesson. Ignore all the other "stuff" that you posted with this chart as you do not need it at all, for it will only distract you from making money. BTW, this type of chart is not what a professional trader uses, and by the looks of things it will be a while before we get into chart lessons.

Second Lesson. Go away and get the average daily range of the stock and volume for the last 30 days, 10 days and 5 days. Post same when you have obtained that.

Third Lesson: Tell me what you probable profit target is based on your selected time frame for trading and your available capital.

As mentioned, I can only respond to what is posted so if people continue to post rubbish then do not expect me to respond. Time is money in this game. You might want to talk with other so called traders and coaches about how good they are and what they can do, but you will not talk with me unless you know exactly what you are looking for, and if you do, I will gladly help you out some.
 
As my debut was not welcomed by some, maybe I can find some real aspiring traders here that want to discuss some realities of trading. I promise not to delete any posts made to my thread, no matter what they are. It is hard for any person to learn if they are not given all the information, even if some of it is not good.

Feel free to ask what you want and I will try me best to give you an honest answer, to the best of my knowledge. If you want a chart analyzed then post it and we will see if we can make some sense out of it. No jokers or time wasters, please. Please note that I speak straight and no bs, so be prepared for an answer that you may not get from others.
OK then - I will present a chart along the lines of the "wot happened next " threads that Barjon used to have. I should add that I have chosen this instrument and time period purely at random and my only criterion was that it was not completely flat.

I am not asking you to decide what might happen next, but if you wish then fine. I merely ask you to display some technical analysis and to tell us what you see in the chart, what points of interest there may be and how you would go about trading this or not trading it.

I have deliberately not given details of the instrument, type of instrument or dates, but you can see that it is a 1 min timeframe. What I am interested in is whether you trade price action, indicators or whatever and how you go about analysing this.

Hopefully this will spawn some conversation.

Charlton
 

Attachments

  • EXPERT_TALKING_POINT.png
    EXPERT_TALKING_POINT.png
    17 KB · Views: 674
OK then - I will present a chart along the lines of the "wot happened next " threads that Barjon used to have. I should add that I have chosen this instrument and time period purely at random and my only criterion was that it was not completely flat.

I am not asking you to decide what might happen next, but if you wish then fine. I merely ask you to display some technical analysis and to tell us what you see in the chart, what points of interest there may be and how you would go about trading this or not trading it.

I have deliberately not given details of the instrument, type of instrument or dates, but you can see that it is a 1 min timeframe. What I am interested in is whether you trade price action, indicators or whatever and how you go about analysing this.

Hopefully this will spawn some conversation.

Charlton

Aha, a real challenge:)

I will do even better for you, but you must draw your own conclusions from the results. All you need do next is post the ticker symbol as it is all I require to make money. I will, in due time, post a chart of this ticker symbol with a profit showing, I say due time as I have a strict regime that I never stray from, so you will get it in due course, but I will not keep you waiting too long.

This is what trading is all about. How many know what I mean?
Why not just give us some thoughts on the technical analysis of the chart as it stands. After that I will supply details of the instrument and the dates and then you can add any further analysis you desire based on knowing the instrument, perhaps introducing fundamentals if that is your thing and even looking beyond the right edge to say how you would trade it.

Charlton
 
If you can make the image a bit bigger I might be able to see some detail. Please post links to full images with high resolution, as anything else is just unprofessional. As I mentioned at the start, no jokers or time waster's please, and that goes for all.

This is a current daily chart of C. Are you saying you do not have access to daily charts of stocks?
 
You could've just reposted it, less effort.

It certainly isnt less effort but ok here:

FYI - I am a Professional Full time Daytrading Scalper & Trading coach for the Affinity Trading Group. I am just interested in engaging in TA discussion with other traders outside of the prop firm I am with.
 

Attachments

  • C Daily.png
    C Daily.png
    675.2 KB · Views: 389
Here is the chart of C with the ATR (in cents) for the three timeframes you asked for as well as everything else you wanted.


Paul
 

Attachments

  • c.jpg
    c.jpg
    118 KB · Views: 469
ok this post was a waste of time.. you posted the chart of C and then didnt really say a hell of alot about it..at least I said I would be bullish.. you said nothing. I thought this post was going to be a bit more interesting but it seems you just ramble on.. if you have something to say just get to the point.
 
The chart was posted because it was requested by "The Expert" so that he can give an analysis of it and for no other reason.


Paul
 
attachment.php


First Lesson. Ignore all the other "stuff" that you posted with this chart as you do not need it at all, for it will only distract you from making money. BTW, this type of chart is not what a professional trader uses, and by the looks of things it will be a while before we get into chart lessons.

Second Lesson. Go away and get the average daily range of the stock and volume for the last 30 days, 10 days and 5 days. Post same when you have obtained that.

Third Lesson: Tell me what you probable profit target is based on your selected time frame for trading and your available capital.

As mentioned, I can only respond to what is posted so if people continue to post rubbish then do not expect me to respond. Time is money in this game. You might want to talk with other so called traders and coaches about how good they are and what they can do, but you will not talk with me unless you know exactly what you are looking for, and if you do, I will gladly help you out some.

Perhaps I wasn't clear enough in my questions. I am not intending to trade off this chart. The question - if insiders offloaded 70 million shares on 2nd Feb - where do we see it ?

The chart is only there to show that the 70 million shares did not impact volume or price.

I don't see how the question is rubbish. Difficult to answer maybe. Rubbish, no.

You did say "Feel free to ask what you want and I will try me best to give you an honest answer, to the best of my knowledge".

If you don't know - that is fine.
 
Last edited:
Status
Not open for further replies.
Top