bullbearRSI

tsunamizawa

Established member
Messages
666
Likes
0
A simple way to detect market bullish OR bearish.
sum stocks on RSI 60 zone and sum stocks on RSI 40 zone.
if bullish , bullRSI line will go up, bearRSI line will go down.
if bearih , bearRSI line will go up, bullRSI line will go down.

how to use print screen
 
Last edited:
A simple way to detect market bullish OR bearish.
sum stocks on RSI 60 zone and sum stocks on RSI 40 zone.
if bullish , bullRSI line will go up, bearRSI line will go down.
if bearih , bearRSI line will go up, bullRSI line will go down.

even simpler, tsunamizawa..
if bullish, price goes up, if bearish price goes down. no need for calculations
 
please attach your chart.

you need a chart to understand if price is going up its bullish and opposite bearish?
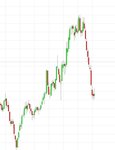
does this help..green =up, red = down
price going up bullish, price going down, bearish
no need for bullbearRSI
 

Attachments

  • Capture.JPG
    Capture.JPG
    48.4 KB · Views: 333
you need a chart to understand if price is going up its bullish and opposite bearish?
does this help..green =up, red = down
price going up bullish, price going down, bearish
no need for bullbearRSI

2 thumbs for you.
So you know very well, bullish or bearish only price up & down.
 
bullbearRSI also gives signal before free falls,
KLCI ( kuala lumpur composite index)
 

Attachments

  • bullbearRSI KLCI0716 1.png
    bullbearRSI KLCI0716 1.png
    72.3 KB · Views: 375
bullbearRSI before freefalls.
JKSE ( Jakarta composite index )
 

Attachments

  • JKSE0715 1.png
    JKSE0715 1.png
    74.8 KB · Views: 337
bullbearRSI give signal before market free falls.
Pilipinas Composite Index
 

Attachments

  • bullbearRSI PSEI0716.png
    bullbearRSI PSEI0716.png
    73.7 KB · Views: 287
Not a bad idea. This indicator similar to several that illustrate whether an overall market or index is bullish or bearish, and whether that relationship is on the point of changing. Most use price changes of the particualr market or index members. The extra value of the indicator compared to using the index itself is that its not weighted by market cap of the members, its an arthmetic average using the number of shares rising/falling.

Whether bullbear rsi is more useful than another market sentiment indicator depends on whether you feel rsi leads price or lags price.
 
A simple way to detect market bullish OR bearish.
sum stocks on RSI 60 zone and sum stocks on RSI 40 zone.
if bullish , bullRSI line will go up, bearRSI line will go down.
if bearih , bearRSI line will go up, bullRSI line will go down.

how to use print screen
bullbearRSI makes crossing, wait who will control the market.
 

Attachments

  • bullbearRSI GSPC0720 crossing.png
    bullbearRSI GSPC0720 crossing.png
    82.5 KB · Views: 287
anyone can compare using bullbearRSI with The Complete Guide of Breadth Indicators by Gregory L Morris.
 
GSPC closing for the last 3 days, more stocks on bearRSI
 

Attachments

  • bullbearRSI GSPC0721.png
    bullbearRSI GSPC0721.png
    81.7 KB · Views: 281
GSPC closing for the last 4 days, more stocks on bearRSI
 

Attachments

  • bullbearRSI GSPC0722.png
    bullbearRSI GSPC0722.png
    81.6 KB · Views: 196
GSPC closing for the last 5 days, more stocks on bearRSI
 

Attachments

  • bullbearRSI GSPC0723.png
    bullbearRSI GSPC0723.png
    82.6 KB · Views: 206
GSPC closing for the last six days, more stocks on bearRSI zone.
 

Attachments

  • bullbearRSI GSPC0724.png
    bullbearRSI GSPC0724.png
    82.9 KB · Views: 193
Back
Top