Joey's MP Journal

Status
Not open for further replies.

Joey25

Established member
Messages
872
Likes
236
Current Trading
Position trading since 2001.
600% of starting capital returned in wages.
Account at 200% of starting level.
Up 70% on the year.

New Venture
This journal, however, is designed to help improve my day trading. The trading style I've been using since 2001 often only involves 1 trade a month and isn't particularly fulfilling.

I'm looking to do 1 or 2 trades a day in the e-mini S&P, working off the 30-minute chart for entries and then using a very short timeframe for trade management. Targets are between 10 and 15 ticks a trade, hopefully $500 per contract, per month.

Preparation
I've read Jim Dalton's "Mind Over Markets" as my primary text.
In addition, I've found helpful things in the "CBOT MP Handbook" (free e-book) and "Value-Based Power Trading" by CISCO's Donald Jones (also a free e-book)

I download my end of day profiles in their raw format from the CME website. I then split this into the Overnight Session and the RTH Session. I've developed what I think is a pretty standard Value Area algorithm, and this will be the first thing I share with you.

Also, I've decided to operate on the short-side. I just find it easier psychologically and I figure I'll be OK in downward trending markets, bracketing markets and gently rising markets.

I probably won't be posting any trades for a while; rather developing the methodology at first, so I apologize in advance!

But as a taster for my style of trading, I'm looking to get short at or around 1280.00 in the Sep S&P. This is the mean of a balance area that formed on the 2nd July and in my opinion the institutions started selling at this level.

Right, let's see if I can explain the Value Area calculation!
 
Last edited:
  • Like
Reactions: BSD
Value Area Calculation

Attached is a spreadsheet with the profile for yesterday's curtailed session in the ES.

The Value Area summary is as follows:

Value Area High = 1271.75
Point of Control = 1264.50
Value Area Low = 1261.75

Early into today's overnight session the market took a clean bounce off the VAL.

Today's RTH session closes at 10.30am Chicago Time due to the holiday.

Joey
 

Attachments

  • EPU8 3rd July.xls
    41.5 KB · Views: 784
Thoughts going into the open

I'm going to start today, even though it's a holiday. Possibly won't trade.

Firstly there is a confluence between yesterday's point of control and the close (1264.50/1265.00). This has been a clear level, neatly dividing the action for most of the overnight session.

We broke above a downward sloping trendline in the pre-market and there's a nice level at 1268.00, the first level around the overnight highs where the market managed to develop a little.

On the big picture, I'm focussing on the 1279.75 level - the 'bulge' of the profile from the 2nd July, plus roughly in line with the big downward trendline on the Daily bar chart.
 
I'm looking to get short at or around 1280.00 in the Sep S&P.

nice start :)

best of luck with the journal.

i don't mean with your method, I'm sure you are more than capable, as your results seem to demonstrate. I mean with maintaining the journal, I tried it once but I rapidly lost interest/momentum in it. let's hope you're more disciplined than I am ...

garry
 
Thanks Garry, it's greatly appreciated.

I'll try to keep up with the spreadsheets as sometimes doing the 'grunt' work like that sparks off some ideas.

Plus I aim to be pretty open about my trading ideas.

Joey
 
Well this curtailed session is coming to an end, and I didn't get filled.

The 2 trades I had planned were as follows:

(1) Sell at 1264.25 with a stop at 1267.75
(2) Sell at 1267.25 with a stop at 1270.00.

Trade (1) is using the last-but-one 30-minute bar from yesterday's RTH session for protection and Trade (2) is using today's overnight high for protection.

you know, because of the time difference and all, I completely forgot it was a holiday today. Sat there for a wee while thinking there must be something wrong with TS or the feed.
Doh !!
 
I'm not experienced enough to know if these Value Areas are tradeable or not, but today's RTH session has:

VAH = 1261.00
POC = 1258.75
VAL = 1256.50

Quite a negative finish, with development taking place below the overnight lows and a new value area completely below yesterday's.
 
Last edited:
Value Area Trades: Aggressive

Part of the reason for starting this journal is to archive any ideas for future reference.

In the last few days there have been a couple of Value Area trades that have been confluent with trendline trades on the 30-minute chart.

This first trade from the 2nd July is aggressive in that the entry point is just above the Value Area High from the previous day's RTH session.

However, given that the natural tendency for a market that re-enters a 'balance area' is to seek out the mean and possibly the other side, it's probably worth a punt.

The left vertical line, on the 2nd green candle, is the RTH open at 8.30am Chicago time.

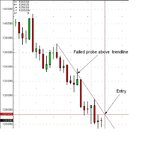
After 3 time brackets (1 1/2 hours!) there is a nice downward sloping support line, which is broken in the next candle. At this point I'm looking for the close of the candle to be below the trendline, with a limit entry sell at where the trendline should be in the next candle.

The alternative could be to wait for the price to actually penetrate the Value Area, but my basic philosophy starting out with daytrading is to wait for the market to come to me.

Joey
 

Attachments

  • 2nd July08 Aggressive Entry.bmp
    175.9 KB · Views: 295
Last edited:
Value Area Trades:Conservative

I didn't actually do this one, because I don't like having targets that need to be beyond the current range to offer a sensible RR.

However, there are good reasons for this one being a conservative entry for someone employing tighter stops than me.

(1) In the 8.30am to 9.00am time bracket, the candle extends upwards into the previous day's Value Area, but closes below. This is a "failed auction" into a level.

(2) There is an upward sloping support line that may become good resistance.

A limit order sell was a possibility at either the VAL or the trendline.

Joey
 

Attachments

  • 4th July08 Conservative Entry.bmp
    175.9 KB · Views: 238
Trade for Monday

This is one I'm looking at for Monday, provided it doesn't trade there in the overnight session. Confluence between a major downward trendline, and horizontal support-turned-resistance.

Sell at 1273.00, with a stop at 1276.25.
 

Attachments

  • potential trade for Monday.JPG
    potential trade for Monday.JPG
    49.3 KB · Views: 409
Last edited:
Targets & Risk/Reward

I've been reading the excellent article by dbphoenix which accompanies the Journals section of this site. The general message that comes across seems to be get prepared ahead of time as much as possible; try to commit to a plan.

So far I haven't mentioned targets. I'm going to distinguish between 'swing" and 'scalp' trades.

Trade Types

For my purposes, a swing trade is going to be defined as a 'big' level that the intermediate and position traders will be looking at. Also, it will be an area that has not been tested in the current 24hr session.

A scalp trade is going to be defined as an overall trade setup with a Risk/Reward ratio close to 1. I know there are other definitions, but this is the one I will use.

Risk/Reward

For the swing trades, I'm going to try and let the trade run. Firstly, the entry point should, at least in theory, interest the higher timeframe players, so there could be a big move. Secondly, if I'm putting my neck on the line anticipating a reaction, I sure as hell want to be rewarded for it.

For the scalp trades, trade location isn't as good since it is by definition not at the edges of the range. However, they should be good for 2 to 3 points.
 
Last edited:
Trade Managment

This final piece of preparation is to do with trade management, which for me is the method of trailing the stop.

(1) In the trade management timeframe, stop movement is firstly only triggered by the formation of a swing high.

(2) Trailing thereafter is based on an ATR calculation.

(3) Swing trades are left to run their course.

(4) Scalp trades have the added twist of not risking a bundle for the last few ticks at the end.
 
Last edited:
Minus Development

"Minus Development" is a phrase coined by Peter Steidlmayer, the original developer of Market Profile theory.

A good example of Minus Development is the 9ema/18ema moving average gap away, retrace and bounce system.

In profiles, Single Prints are the most obvious examples of Minus Development. Single Prints are areas of the profile where a price was only traded in a single half-hour bracket during a session. They represent areas of low volume, or prices at which there was a swift rejection by the market. I've uploaded the profile for the 2nd July EPU8 profile and identified two Minus Development areas.

The first area is 1286.00/1286.25 and the second is 1275.75/1276.25.

These areas can be used as entry levels in themselves or as areas for stop placement.
In the trend trade I posted yesterday, I'm hoping to use an area of Minus Development for stop placement:

Sell at 1273.00, with a stop at 1276.25

In contrast, the 1279.50, the point of control or the "bulge" of the profile is an area of Development. This is an area I'm interested in for another of my planned trades:

Sell at 1279.25, with a stop at 1282.50.

Joey
 

Attachments

  • EPU8 2nd July.xls
    49 KB · Views: 264
7th July Trade1

Trade1 (Swing)

Entry: 1273.00
Stop: 1276.25
Exit: 1273.00
Gross P/L: 0

Got onside by 9 ticks with this one, but the objective is to let the swing trades run.
 
Initial Balance

1 1/2 hours into the RTH session is about the minimum time that must pass before 2-way balanced trade can occur in the stock indices. This is called the Initial Balance.

At this point it's a good time to anticipate potential plays later in the day.

Today we have a narrow balance area between the high of the 4th July (1269.25) and that Minus Development area from the 2nd July (1275.75/1276.25).

An upside breakout form this narrow balance area will hopefully lead to a reaction from the 1280.00 area I'm interested in.

A downside breakout could lead to some single prints below 1268.00 leaving 2 potential trades of either the mean of the current balance area or a single print trade.

Only guessing of course, but it's good to write it down real time, like dbphoenix says.
 
Potential Scalp

There's a potential scalp setup, with confluence between the settlement price (1265.00) and a downward sloping support line on the 30-minute chart. With a stop placed just above the top of the overnight value area (1267.00), overall a good percentage play.

Specifically:

Plan A
Sell at 1264.25, with a stop at 1267.75, target at 1261.00

Needs a close of the current 30-minute bar below 1265.00, which seems likely. The fill needs to occur in the subsequent 30-minute bar.

Should that fail, I'll be switching to a standard "Single Print" play, which will be:

Plan B
Sell at 1264.75, with a stop at 1268.75 (above the big "spike" bar), with a target at 1261.00.

Other than that, it's a matter of waiting for a new balance area to form and take it from there.
 
Last edited:
Leaning on the Single Prints

Another setup has presented itself. Where there is a balance area breakout followed by a large set of single prints, it is possible to "lean on" the single prints.

The current session has a huge set of single prints stretching from 1257.00 to 1265.25.
The 1257.00 corresponds to both the overnight low (1257.00) and the 4th July low (1256.50), so there is meaning to the level.

The trade is: sell at 1256.00, with a stop at 1259.75 and a target at 1252.50 (again a scalp trade as it is a trade within the current range).
 
7th July Trades 2 & 3/ End of day

Trade 2
Sold at 1256.00
Stop at 1259.75
Tgt at 1252.50
Exit at 1259.75
Gross p/l = -3.75

Trade 3
Sold at 1264.75
Stop at 1268.75
Tgt at 1261.00
Exit at 1262.50
Gross p/l = +2.25

Summary for the day
Gross p/l = 0.00 -3.75 + 2.25 = -1.50
 
EPU8 Value Area for use 8th July

Value Area High = 1266.00

Point of Control = 1247.25

Value Area Low = 1241.75
 

Attachments

  • 7th July.xls
    50 KB · Views: 284
Status
Not open for further replies.
Top