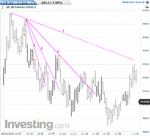
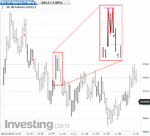
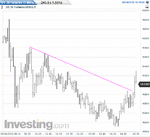
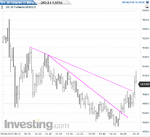
If I may, and considering the extent of your experience in trading, you would likely get the most out of this exploration by providing the context, what I refer to as approaching the trade. If these movements are analyzed without context, in the middle of nowhere, they are essentially meaningless, at least in terms of extracting profits from them.
You've seen my display, the "sextych", with the daily, hourly, 15m, 5m, 1m, and 5s all grouped together. This enables me to see what I need to see and assess in no more than a minute where we are and why and where we're most likely to go. Whether anyone else adopts this or not is up to him. But one should plot a weekly chart at least once a week (it needn't be part of the display) and a daily, hourly, and 5m chart (and a 1m, if daytrading). Appendix G in the book should make the reasons why clear.
The following is provided as an example. The weekly would not ordinarily be included, and an EOD trader wouldn't care about 5m or 1m charts. But it's a starting point. It perhaps illustrates what I mean by the "gestalt" of the trading environment.
These charts lead up to the NY open. If you want to annotate them, I'll review your work if you like. This preparation is not unlike that of preparing a performance in a play: reading the script, learning your lines, understanding who your character is, who the other characters are, your relationships with them, their relationships with each other, what they've been doing, what you've been doing, where you've come from, what you want to accomplish, whether your goals will be in synch with those of the other characters or will conflict with them, and so on, as opposed to simply walking on stage without even knowing what play you're in.


