F
ford
'No indicators' revisited.
A few of us regulars from the Trade2win chatroom who are thirsty for knowledge and insight, thought it may be a good idea to revive the discussion on trading without indicators, a method that appears to be neglected and shunned in favour of a plethora of casino frontends, that regurgitate potentially useful data full of clues for trades in the form of fancy colours and squiggly patterns when it may not infact be nessesary to do so - simply because we do not open our eyes to the information that price and volume is giving us in its naked form.
Given the direction of some threads, it might be best that the thread is focused upon exchanging ideas and teaching principles with the help of references to charts, rather than a handheld summary of the market day in day out.
To be quite honest I do not know where to begin my study, there are many variables in pure price action that can be analyzed as far as I have so far conceived; size of bars relative to others, volume, timeframe, context, high, low, open, close, entry, exit, risk management and how they all relate to each other. I'm sure there are more that have escaped my eye.
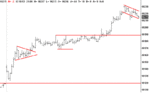
I suppose to start this thread off, I'll post a chart of Thursday the 18th:

Now, it seems to me that trading on price action and taking trades on breaks of Bar highs and lows requires active management of positions to bail out of a trade and reverse or go flat if the break is simply a anomaly in the underlying trend of the price action. The lines in red are examples of what I see as points to short based upon bar lows being violated, but as one can see they are really trades done in vain. Obviously at the time, we don't know whether they are anomalies, or are there signs in previous price and volume that suggest otherwise that I'm not seeing? :cheesy:
From the 'house' perspective, suckering in shorts based upon the bar makes for good fuel to burn, but like I ask.. how do we protect ourselves?
I hope this has got the thread rolling.. I know I have plenty more questions and look forward to hopefully passing on knowledge when I network with more individuals in the future.
A few of us regulars from the Trade2win chatroom who are thirsty for knowledge and insight, thought it may be a good idea to revive the discussion on trading without indicators, a method that appears to be neglected and shunned in favour of a plethora of casino frontends, that regurgitate potentially useful data full of clues for trades in the form of fancy colours and squiggly patterns when it may not infact be nessesary to do so - simply because we do not open our eyes to the information that price and volume is giving us in its naked form.
Given the direction of some threads, it might be best that the thread is focused upon exchanging ideas and teaching principles with the help of references to charts, rather than a handheld summary of the market day in day out.
To be quite honest I do not know where to begin my study, there are many variables in pure price action that can be analyzed as far as I have so far conceived; size of bars relative to others, volume, timeframe, context, high, low, open, close, entry, exit, risk management and how they all relate to each other. I'm sure there are more that have escaped my eye.
I suppose to start this thread off, I'll post a chart of Thursday the 18th:
Now, it seems to me that trading on price action and taking trades on breaks of Bar highs and lows requires active management of positions to bail out of a trade and reverse or go flat if the break is simply a anomaly in the underlying trend of the price action. The lines in red are examples of what I see as points to short based upon bar lows being violated, but as one can see they are really trades done in vain. Obviously at the time, we don't know whether they are anomalies, or are there signs in previous price and volume that suggest otherwise that I'm not seeing? :cheesy:
From the 'house' perspective, suckering in shorts based upon the bar makes for good fuel to burn, but like I ask.. how do we protect ourselves?
I hope this has got the thread rolling.. I know I have plenty more questions and look forward to hopefully passing on knowledge when I network with more individuals in the future.

