I'm hoping to set the ball rolling for a discussion of trading with 1-2-3-formations and Ross Hooks, after there's been some interest expressed in these methods recently in other threads.
I thought I'd start off with an example and chart, and now seems a nice time to do so, since I'm trading the EUR/$ at the moment on one of these set-ups.
In my next post, I'll give a link to an online introduction to 1-2-3's in "pdf" (Adobe) format which readers may download, save and print if they want to, and I'll try to give something approaching a "definition" of a Ross Hook without breaching Joe Ross's copyright, if I can.
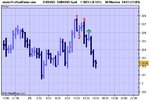
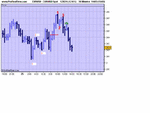
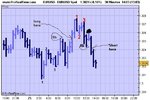
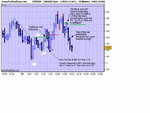
But for the moment, let's talk about this chart ... it's a EUR/USD 30-minute chart from today, and like all my charts, the times shown on it are CET (that's GMT + 1 hour).
The "points" of the 1-2-3-formation are shown in red. The idea is to enter into the downtrend established by the 1-2-3-formation (which itself marked the end of an uptrend, of course), by entering a short position when the price broke through the 2-point, as happened a couple of bars later. Alternatively, one can use Joe Ross's "Traders Trick Entry" (as I did) by entering the short position higher up on the same bar, in the hope that if the "entry signal" turned out to be a false one, one would be able anyway to cover the spread and exit without loss, or even possibly with a small profit. This is a bit of a gamble, but it worked well on this occasion.
The stop-loss for this trade would be placed typically 2 or 3 pips above the "1-point", which is fairly close, as you can see from the chart. One might want to use a different method of stop-placement if a "round number" were involved, especially on an instrument as liquid as this one, but that subject's for another day. The point here is that if prices go up past the "1-point" it invaldiates the trade entry and means that we've basically "got it wrong", so it's where we'd want to get out, simply because we have no reason for being there.
A couple of bars after entering this trade, there was a Ross Hook (shown in green), which was the first failure of a price-bar to make a lower high during the downtrend. The significance of this is that if prices had subsequently turned around and risen (which they didn't), the taking out of the Ross Hook would have been an entry for a long trade (which didn't arise). So in this case the Ross Hook was not relevant to the trade, and I'm showing it simply because it was conveniently there.
Key concept, widely misunderstood: the fact that the top of that bar constituted a Ross Hook was not defined until the bar following it had closed. (Until then, it might have been a reversal). A Ross Hook can arise only during a trend (this is really fundamental), and can be defined only by looking at the bar after it.
My aim with these trades is to close a third (or sometimes a half) of the position fairly quickly to cover the trading costs, and then to let the remaining two-thirds (or half) run, closing it either in one go or in two seperate chunks, depending on all sorts of factors which (as the saying goes) we can talk all about some other time. For the moment, let's just say that 1.3020 or 1.3021 would be a possible "final exit" on this trade, for the unambitious like me anyway, because one might think it would be an area of some expected support, as can be seen from the bottom of the price bar 7 bars before the entry of the trade.
These 1-2-3-formations and Ross Hooks can be traded on virtually any instrument and any time-scale. Personally I find 15-minute and 30-minute charts useful. I sometimes use 10-minute charts as well, if I feel like conentrating hard and haven't got other things to do at the same time. Those wanting to make frequent trades are naturally more inclined to use charts of lower periodicity, to increase their "trading opportunities". They also increase their variability and chances of accidents, quite a common reason for failure. (I offer the observation that it's easily possible, by using charts which are too fast for your money-management and specifically position-sizing, to get wiped out with a system that would have made steady profits on slower charts.) But now we are talking more about risk-patterns and money-management than the trading method itself.
I know from PM's etc. that several other people here are trading these set-ups, so let's hope we can get some interesting discussion going.


