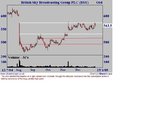
Long Candles as support or resistance: Fact or Fiction?

barjon

Legendary member
Messages
10,752
Likes
1,863
In view of comments I've made on FTSE and Price/Volume threads a few people have suggested that I start a thread on the topic and maybe other candlestick patterns in due course.

Firstly, for those interested in candlesticks the authority is Steve Nison and his books: Japanese Candlestick Charting Techniques and ; Beyond Candlesticks. I hope he won't mind if he recognises the odd sentence here and there 🙂

I'll talk about long white candles - which are up candles - and support, but remember that the reverse applies to long black candles - down candles - and resistance.

A long candle is one which is unusually long in the context of the usual price range of the instrument concerned. The time interval of the chart is immaterial, but I prefer "genuine" trading periods where books are opened and closed - daily, weekly, monthly - rather than the more "artificial" periods such as 10minute, 1 hour or whatever.

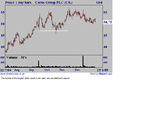
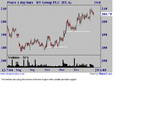
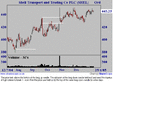
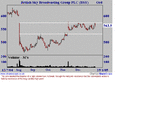
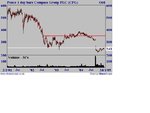
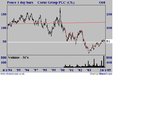
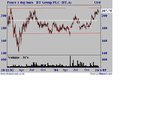
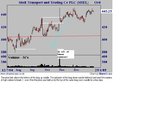
Candlestick analysis suggests that a long white candle should provide support, particularly in a rising market.. That support is found at either the middle of the long white candle's real body or the bottom of the entire white candle, including the lower shadow. One can sometimes extrapolate backwards from these points to find them co-incident with traditionally drawn support lines, in which case the candle supports serve to confirm those support lines and maybe give them added importance.

If one is using a daily interval then intraday penetrations are not considered to violate the support as long as the close holds above the support level. Similar for other chart intervals.

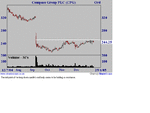
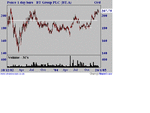
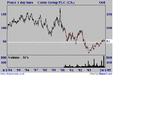
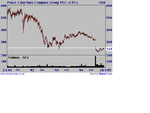
Anyway, enough chat for now - here's a few examples.
 

Attachments

  • corus.gif
    corus.gif
    10.7 KB · Views: 915
  • bt.gif
    bt.gif
    11.6 KB · Views: 867
  • shell.gif
    shell.gif
    12 KB · Views: 781
  • bsb.gif
    bsb.gif
    10.6 KB · Views: 715
  • compass.gif
    compass.gif
    9.1 KB · Views: 715
Last edited:
barjon said:
In view of comments I've made on FTSE and Price/Volume threads a few people have suggested that I start a thread on the topic and maybe other candlestick patterns in due course.

Firstly, for those interested in candlesticks the authority is Steve Nison and his books: Japanese Candlestick Charting Techniques and ; Beyond Candlesticks. I hope he won't mind if he recognises the odd sentence here and there 🙂

I'll talk about long white candles - which are up candles - and support, but remember that the reverse applies to long black candles - down candles - and resistance.

A long candle is one which is unusually long in the context of the usual price range of the instrument concerned. The time interval of the chart is immaterial, but I prefer "genuine" trading periods where books are opened and closed - daily, weekly, monthly - rather than the more "artificial" periods such as 10minute, 1 hour or whatever.

Candlestick analysis suggests that a long white candle should provide support, particularly in a rising market.. That support is found at either the middle of the long white candle's real body or the bottom of the entire white candle, including the lower shadow. One can sometimes extrapolate backwards from these points to find them co-incident with traditionally drawn support lines, in which case the candle supports serve to confirm those support lines and maybe give them added importance.

If one is using a daily interval then intraday penetrations are not considered to violate the support as long as the close holds above the support level. Similar for other chart intervals.

Anyway, enough chat for now - here's a few examples.

Hello barjon

Thought you could get away from me by starting your own thread. No chance

Just want to get the ground rules straight. No editing my posts if : you do not agree with me, I am rude to you or I indulge in extreme verbal abuse. Glad thats clear.

Would it be possible for you to repost a 3 or 5 year chart of the companies you have selected and to mark where you think support/resistance occurs using the conventional analysis ie price action. Excuse me giving you this task but you have such nice charts, mine are ugly in comparison.

In the meantime I, and may I suggest other readers look for charts that snuff out the barjon candle.

Regards

bracke
 
Interested to see your post as in process of studying candlesticks, both SN's Beyond Candlesticks and Greg Morris Candlestick Charting Explained.
The support concept is interesting. (As an aside when looking at FTSE100 (UKX) I have a problem though as it appears that data providers use yesterdays close as todays open which makes using candlesticks difficult).
Particularly interested in filtering candlestick signals using other indicators and Relative Momentum seems to work quite well. Do you use any filters?
 
Been off piste a bit. Spent yesterday at Newbury races. All a bit like my trading recently - good selection, poor money management. I managed 3 winners but still finished up a touch below break even 🙄 A good day out though.

bracke

It's only the mods who can edit (those personal forum thingies excepted) and I'll be asking them to keep a close eye on you 😉

Extrapolated a couple backwards and leave you to decide.

swampy

Some data providers follow LSE guidelines (today's open = yesterday's close) and others take account of the pre-market auction and show a gap opening. Sharescope, for example, have fairly recently changed to the latter.

Oddly enough you mostly get the same message by differents means. For example let's say todays close was at the high of a recent trend and tomorrow gapped up and the fell back to close unchanged - the candle from the open=close provider would be a potentially ** bearish gravestone doji and the candle from the other a potentially bearish counterattack line.

** potentially because all single candles and reversal patterns need the confirmation of subsequent price action. It's also worth bearing in mind that candlestick reversal patterns merely imply that the prior trend is likely to change not necessarily reverse - it might go sideways for a bit before the prior trend continues or then truly reverse.

I don't trade candlesticks as such. I use them mostly to inform my exit decisions and to inform my position size in my swing trading.

good trading

jon
 

Attachments

  • bt.gif
    bt.gif
    12.4 KB · Views: 563
  • corus.gif
    corus.gif
    10.6 KB · Views: 587
  • compass.gif
    compass.gif
    11.1 KB · Views: 597
barjon said:
Been off piste a bit. Spent yesterday at Newbury races. All a bit like my trading recently - good selection, poor money management. I managed 3 winners but still finished up a touch below break even 🙄 A good day out though.

bracke

It's only the mods who can edit (those personal forum thingies excepted) and I'll be asking them to keep a close eye on you 😉

Extrapolated a couple backwards and leave you to decide.

swampy

Some data providers follow LSE guidelines (today's open = yesterday's close) and others take account of the pre-market auction and show a gap opening. Sharescope, for example, have fairly recently changed to the latter.


Oddly enough you mostly get the same message by differents means. For example let's say todays close was at the high of a recent trend and tomorrow gapped up and the fell back to close unchanged - the candle from the open=close provider would be a potentially ** bearish gravestone doji and the candle from the other a potentially bearish counterattack line.

** potentially because all single candles and reversal patterns need the confirmation of subsequent price action. It's also worth bearing in mind that candlestick reversal patterns merely imply that the prior trend is likely to change not necessarily reverse - it might go sideways for a bit before the prior trend continues or then truly reverse.

I don't trade candlesticks as such. I use them mostly to inform my exit decisions and to inform my position size in my swing trading.

good trading

jon

B]barjon[/B]

Pleased to read you had an enjoyable day at the races , if not a profitable one.

I have taken your charts and added some additional s/r lines in red.

I am not certain what this shows us but I think it may be a question of what came first, the price action s/r price or the barjon candle s/r price. I suppose that what I am saying is that your candle theory may be no more than coincidence ie. the true s/r is the conventional price action one and the candle theory works when it happens to coincide with the true s/r price.

On one of the charts I have noted where your theory appears not to hold good.

Regards


bracke
 

Attachments

  • untitled.jpg
    untitled.jpg
    40.4 KB · Views: 586
  • untitled.jpg2.jpg
    untitled.jpg2.jpg
    40.3 KB · Views: 587
  • untitled.jpg3.jpg
    untitled.jpg3.jpg
    44.1 KB · Views: 583
  • untitled.jpg4.jpg
    untitled.jpg4.jpg
    49.2 KB · Views: 610
  • untitled. jpg 5.jpg
    untitled. jpg 5.jpg
    44.5 KB · Views: 577
bracke said:
B]barjon[/B]


On one of the charts I have noted where your theory appears not to hold good.

Regards


bracke

😆 Not my theory dear chap, but that of venerable Japanese rice traders operating in the mid seventeen hundreds.

Show me any way of determining a support/resistance line (or any technical pattern come to that) and I'll show you plenty of examples where it doesn't hold good. I'm not championing this method, just diligently reporting on a particular aspect of candlestick analysis. There are plenty of other aspects upon which I set greater store - shooting stars and hammers to name but two.

good trading

jon
 
barjon said:
😆 Not my theory dear chap, but that of venerable Japanese rice traders operating in the mid seventeen hundreds.

Show me any way of determining a support/resistance line (or any technical pattern come to that) and I'll show you plenty of examples where it doesn't hold good. I'm not championing this method, just diligently reporting on a particular aspect of candlestick analysis. There are plenty of other aspects upon which I set greater store - shooting stars and hammers to name but two.

good trading

jon

barjon

My apologies for crediting/discrediting you with the theory.

I appreciate some things do not change but the comparison of trading rice 300 years ago and trading shares etc now might be considered tenuous.

I appreciate that no method is 100% correct but would suggest that the conventional one is more so than honourable rice trader's.

I will try to keep an open mind on the subject and take note of long candles when I look at charts

By the way do you know if it works on the pot noodle futures chart or is this off topic?

Regards

bracke
 
bracke said:
barjon

.

I appreciate some things do not change but the comparison of trading rice 300 years ago and trading shares etc now might be considered tenuous.

I appreciate that no method is 100% correct but would suggest that the conventional one is more so than honourable rice trader's.


Regards

bracke

Why tenuous? They were trading a futures market and supply and demand hasn't changed.

The early candlestick analysts would claim that theirs is the conventional one and that western technical analysis is but a parvenu upstart. It's no surprise, of course, that there is a great deal of confluence since both, in their own ways, are trying to establish the same things.

Don't be too quick to dismiss candlestick analysis on this one example. There are other ways of establishing support/resistance areas which have a higher probability than long whites/blacks and you can't judge the book by the first paragraph.

The only futures I get from pot noodle can't be mentioned in polite society 😱

good trading

jon
 
barjon said:
Why tenuous? They were trading a futures market and supply and demand hasn't changed.

The early candlestick analysts would claim that theirs is the conventional one and that western technical analysis is but a parvenu upstart. It's no surprise, of course, that there is a great deal of confluence since both, in their own ways, are trying to establish the same things.

Don't be too quick to dismiss candlestick analysis on this one example. There are other ways of establishing support/resistance areas which have a higher probability than long whites/blacks and you can't judge the book by the first paragraph.

The only futures I get from pot noodle can't be mentioned in polite society 😱

good trading

jon

I accept that the base nature of supply/demand has not changed but I am sure you will accept that the methods have eg computers, internet etc. Would it not be reasonable to consider that these factors may well have changed the nature, use and analysis of candlesticks.

I have not dismissed candlestick analysis, indeed in my last post I said that I would keep an open mind on the subject. So no more erroneous statements otherwise I will be forced to request that you be moderated.

Best to draw a veil over your pot noodle activities.

May your candle burn at both ends.

Regards

bracke
 
barjon

Considering the number of people who use candlestick charting I had expected your thread to attract a reasonable number of posters.

Does the lack of interest suggest that people use candlesticks merely as a means of applying indicators and that deeper analysis of the price action in relation to the candle shape is not widely used or restricted to the more conventional analysis.

Regards

bracke
 
ok, time to stick my oar in..et tu Bracke?

rollocks.

over the weekend i had a look at this idea suggested by Barjon. I tried testing it on the dow, with a few assumptions..

ie, that a long candle was one that had a range large than any of the previous X number of days.

i found that if the dow closed above/below the midpoint of the last candle that met this criteria, and then passed through the midpoint, it was likely to continue for the next few days at the very least.

thus, if anything, i find the opposite to be the case. I will try to dig up the spreadsheet if required, but i warn you that i did try to code it all up at about 3am after a lengthy dinner party...

🙂
 
FetteredChinos said:
ok, time to stick my oar in..et tu Bracke?

rollocks.

over the weekend i had a look at this idea suggested by Barjon. I tried testing it on the dow, with a few assumptions..

ie, that a long candle was one that had a range large than any of the previous X number of days.

i found that if the dow closed above/below the midpoint of the last candle that met this criteria, and then passed through the midpoint, it was likely to continue for the next few days at the very least.

thus, if anything, i find the opposite to be the case. I will try to dig up the spreadsheet if required, but i warn you that i did try to code it all up at about 3am after a lengthy dinner party...

🙂

Hello Seymour

I thought that you were a golfer nor a rower, perhaps niblicks would be a better expletive.

I would be interested in looking at your intoxicating spreadsheet.

Be warned, barjon will disavow all responsibility for the theory and blame some poor wretched Chinese rice farmer who lived a few hundred years ago.

Regards

bracke
 
8-iron please, Odd-Job.


ok, here we go. tarted up the sheet a bit to make it look reasonable. think the formulae are correct too.

taking the largest candle for the last 15 days as a "long candle" and using that midpoint as support/resistance. a break of it seems to imply a continuation. at least that is what this seems to suggest..

FC
 

Attachments

FetteredChinos said:
8-iron please, Odd-Job.


ok, here we go. tarted up the sheet a bit to make it look reasonable. think the formulae are correct too.

taking the largest candle for the last 15 days as a "long candle" and using that midpoint as support/resistance. a break of it seems to imply a continuation. at least that is what this seems to suggest..

FC

Did the sheet get hooked into the trees or sliced into the rough?

EDIT pleased to see you managed to play it back on to the fairway.

Regards

bracke
 
Seymour

Can you explain Chart 1 please

At what point did you close the trade to show + or -

Regards

bracke
 
fc

My poor old works.xls can't cope with the full monte. 🙄

I'm not sure you can deal with it so mechanically - context and judgement play a part - but it'd be interesting to know if the continuation went on to break the low/high of the whole candle. As venerable rice trader might have said "When the enemy storm the citadel gates flee to the sanctuary of the inner fortress and get the oil boiling " 😆

good trading

jon
 
erm i experimented with closing the trade after any number of days ranging from the same day, to 20 days after.

pretty much all of them ended up with a negative overall result.

eg buying dips to the midpoint and selling bounces to the midpoint is largely unprofitable.

in fact, the opposite is the reverse.

this is tested on daily data, so things can look a bit wonky, but i dont believe that this theory entirely holds water on indices. it may work on stocks, but the Dow doesnt fill me with too much hope.

FC
 
hmm, have quickly tried to use the low and high of the big candles as s/r levels, and to give the Big Man credit, they dont get breached anywhere near as often. which is i suppose what you would expect.

i just wonder if this can be put to some serious practical use......


might need the 5-wood for a soft landing on this approach.

greens like marble today.

FC
 
barjon said:
fc

My poor old works.xls can't cope with the full monte. 🙄

I'm not sure you can deal with it so mechanically - context and judgement play a part - but it'd be interesting to know if the continuation went on to break the low/high of the whole candle. As venerable rice trader might have said "When the enemy storm the citadel gates flee to the sanctuary of the inner fortress and get the oil boiling " 😆

good trading

jon

Ah yes of course, context and judgement, the refuge of the inscutable.

Would we accept context and judgement as reasons for the failure of conventional support/resistance to hold, I think not.

Once a price zone has been identified as s/r I am not aware that context and judgement are applied should it fail to hold, failure to hold is a breakout.

When on the wrong side of a breeakout as fleeing bracke would say " Stuff this for a lark, action the stop, close the trade and breakout the scotch".

Regards

bracke
 
Possibly worth noting that many honorable rice traders suggested that body of long candle needed to be 3 times length of recent candles.
 
Back
Top