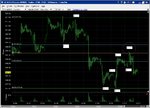
Gold Wave Count

snowrider

Well-known member
Messages
423
Likes
3

Attachments

  • 20100716 Gold - Daily.jpg
    20100716 Gold - Daily.jpg
    58.6 KB · Views: 293
I did a little digging into this concerning PIN bars. It was a learning experience for me. I guess they are called PIN bars after Pinnochio, because they lie about the direction they say they are headed in.
Do you use PIN bars as a standalone, or do you use other indicators as a confluence?


Dont know about the wave stuff but you have 11 PIN bars there and I think 8 of them would have given you a very nice profit. 3 would have been stopped out using the conventional rules.
 
I did a little digging into this concerning PIN bars. It was a learning experience for me. I guess they are called PIN bars after Pinnochio, because they lie about the direction they say they are headed in.
Do you use PIN bars as a standalone, or do you use other indicators as a confluence?

I normally only use them at support and resistance levels, I will plot weekly pivot points and then look back on a 4hr chart for other obvious levels and plot these as well. I will generally watch the 5 and 15 minute charts to take trades. Occasionally I will also take one if it looks really good and its at an extreme on the stochastic but I am normally more nervous about those ones and generally only take a couple of ticks.
 
I should add that on the example I posted I was identifying them as standalone PINs and they did quite well.
 
I normally only use them at support and resistance levels, I will plot weekly pivot points and then look back on a 4hr chart for other obvious levels and plot these as well. I will generally watch the 5 and 15 minute charts to take trades. Occasionally I will also take one if it looks really good and its at an extreme on the stochastic but I am normally more nervous about those ones and generally only take a couple of ticks.

Thank you guys for your responses. I am new here, and this is my first thread that gets response. About your pin bar theory, yes, it works. It's actually has been used dated back to hundred years ago in Japan. It's called "doji" (or star) in the Candle Chart Theory. Here is a good book that you can find the info about that:

http://www.amazon.com/Japanese-Candlestick-Charting-Techniques-Second/dp/0735201811

Its not quite the same, I think a doji has to have an equal open and close, a PIN doesn't. But in any case you get the idea, its showing a rejection of a higher price.
 
Its not quite the same, I think a doji has to have an equal open and close, a PIN doesn't. But in any case you get the idea, its showing a rejection of a higher price.

I agree with you that they are not quite the same. Their implications are similar. We can treat small pin as a doji - showing hesitation. The only different one is the long pin (or a medium long pin), which shows changing hands or washing some people out.
 
I agree with you that they are not quite the same. Their implications are similar. We can treat small pin as a doji - showing hesitation. The only different one is the long pin (or a medium long pin), which shows changing hands or washing some people out.

Theres a short PIN right there in your avatar!
 
I use Doji a lot in my short term trading (i only do short term). Great sign of indecision and poss good entry point if you can stack it up.
 
He is referring to the one in your profile picture ! Unless that was the one which was taken last thursday ?

Later

Oh I see what you guys meant. Thanks!
My captured this profile icon image about ... maybe 10 or 15 years ago from a intraday SP chart. I like this image because it shows many things: bull thrust, pin, correction, trap, and then breakout.
 
this is entry and just to say hello

Hi Entry, nice to see you here. I decided to stay and post my charts in this forum instead of elite because this forum provided a very good user interface. Sorry for replying late, for I went to my dentist in the morning and did some shopping the rest of the day. Since we are all shorting gold, attached is my wave count for the hourly GCQ10. So far gold is moving south as we expected. My stop will be 1 point above the hourly wave-c. If the market ever penetrates that point, I'll liquidate all my gold short and take a break.
 

Attachments

  • 20100721 Gold - Hourly.jpg
    20100721 Gold - Hourly.jpg
    116.8 KB · Views: 155
Back
Top