Anyone scalping the FTSE Futures??

MartinC-J

Established member
Messages
967
Likes
26
I have been paper trading the FTSE Futures for over a year now, with occasional trades live. I would like to find other FTSE Futures Traders and compare notes.

I am consistently profitable on the Sim, averaging £400 per day allowing for commissions, but to achieve this I am doing 30+ trades per day. I trade one contract only, but add more if a trend continues. My average winner is £35 and my average loser is £20. My win/loss ratio is roughly 60% winners, 40% losers.

I am a very short term trader with most trades lasting 2 to 9 minutes.

My price targets are 6 to 10 points, depending on the price action.

My stops are usually 4.5 points if entered on a limit order, or 5 pts if on a stop order.

I use direct market access trading using the Open ECry platform. You get filled at the bid or the ask, and there is no spread to pay. Most people in the UK seem to use spreadbetting to trade the FTSE cash. They pay a minimum of 0.5 points per side in spread, which costs them £10 per trade, which makes it much harder to make a profit when you are scalping. My fees are £1.81 per trade.

As for strategy, I trade reversals, continuations, pullbacks and breakouts.

With the FTSE, a 2 point move above or below the previous 5 minute candle is significant enough to signal a change of trend most of the time.

I use support and resistance from the 60 minute and daily charts, and watch the 5 min, 1 min and 50 volume charts all the time.

As soon as a reversal is in, I look for retracements to the 38%, 50% and 61.8% levels.

I don't use pivots, but I make a rough note of where they are. They work better for swing trades, and are less accurate for scalping.

A 2 point move away from a S/R or fib level is enough for me to consider a change of trend.

I use the 5 min chart to monitor trends and the 1 minute chart to time my entries.

I watch how price action moves between upper, middle and lower boly bands on the 5 min chart, to decide my bias. This mid line is critical. Below mid bb, take short entries only. Above mid bb, take longs only, unless it bounces off a strong level. Importantly, I use an 8 period setting for bolys on the 5 min chart.

Pullbacks to the 5 EMA on the 5 min chart are good entries for a steady trending market.
Pullbacks to the 5 EMA on the 1 min chart are good entries in rapidly falling/rising markets.

I trade from 8am to 11am usually, and 2:30pm to 4:15pm, UK time. In the morning, I watch the ES and FESX for confirmation of moves by the FTSE. In the afternoon, I watch the ES for trend but trade the FTSE depending on what happens with the ES.

I am trying to reduce the number of trades I take, and cherry pick which trades to take. I also and trying to run my trades longer, but when I get 10 points up I usually close and bank the profit.

I am interested to see how many others scalp the FTSE futures like me, and if they are comfortable taking so many trades in a day. Also what set ups do they use that are successful.
 
As mondays go that was a fairly usual mincy day where we never got any decent steady price action with neat trend bars. The first 50 mins did not have much conviction and it wasn't until 8:50am when it breached the trendline did we get a clear move. Unfortunately the clear move didn't last very long and it ended in 15 minutes of sideways movement before finally breaking the level at 5824. The 9:20am bar was a fake down before reversing back up. It then too ended in 15 minutes of consolidation. Not fun trading this and more a market for the pros.

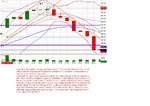
I have attached my 5 min chart for the morning and you can see that after the double bottom at 8:40 am the move up is nicely contained by the mid Boly Band, and after the double top at 10:10am, the down move stays mostly below the mid Boly Band. I use an 8 period setting for the boly bands for the 5 min chart. Above or below the mid boly and I change my bias from long or short.
 

Attachments

  • Mon 14 March 2011 5 min chart.jpg
    Mon 14 March 2011 5 min chart.jpg
    109.3 KB · Views: 5,959
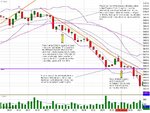
I always find sharp and rapid price movements a bit frenetic, especially when you are a scalper. The important thing to do is stay calm and look for safe entries on pullbacks to the 5 period EMA on the 5 min chart. I know some books tell you to enter on sell stops on the break of a new low, but with the volatility of a sharp movement, sometimes that works and sometimes it spikes up and takes out your stop. Getting in on a pullback is much safer, and usually the 5 EMA on the 5 min chart is pretty good. Doesn't mean you won't get stopped out occasionally.

The other problem with rapid down moves is that you never know when it is going to stop. Also, the temptation to go countertrend is very strong, but there really are very few low risk entries, and assuming that it has to bounce has cost me in the past. Any previous support and resistance levels tend to get ignored so it is difficult to pick a target. Any suggestions from anyone here would be appreciated. These sharp down trends often end in a big climax blow-off and the last two 5 min candles were the longest of this move and gave you some kind of signal that the run would end with a bang. If you get stopped out by a move about 5 points above the 5EMA then you can assume the trend has run out of steam. With as many as 6 pullbacks to the 5EMA, you should have caught a lot of the down move before being stopped out.

We did get a retest of the low at 5584.5 which gave us a very nice double bottom that retraced 38% initially and then 61.8%, before saying that's enough up. If the 61.8% holds, then I am expecting the yanks to test the lows again when they open at 1:30pm.
 

Attachments

  • Tues 15th March 2011.JPG
    Tues 15th March 2011.JPG
    173.6 KB · Views: 2,528
  • Tues 15th March 2011.JPG 1 min chart.JPG
    Tues 15th March 2011.JPG 1 min chart.JPG
    232.5 KB · Views: 4,755
When I get the chance I will post the 1 min chart to back things up.

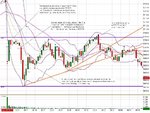
My first trade of the day was a loser. The price gapped down from the open by 32 points from the close at 7:50am just ten minutes earlier! Such a big gap is unusual for only a 10 minute period. There may have been some news taht created sucha gap, and I haven't checked back to see at what time Moody's downgraded Portugese debt. Anyway, I took the first 2 point move towards the gap at 8:01 and got stopped out a minute later right on my stop of 4.5 points. It traded sideways for 5 minutes and then broke down which I did catch. I was triggered short at 5699.5 at 8:07am on a 2 point move below the low of the 8:05am candle of 5701.5.

For a price target I always have the low of the morning as my first target, and then if it goes through that I look for the next support and resistance level below. It did hit the prior low at 5691.0, bounced 3.5 points before going back down to within 0.5 points of the next level below at 5678.5. I was a little greedy and had my target right on the level at 78.5 and didn't get filled. Usually I set targets a point short of previous support levels, which would have been filled this time. So much for getting greedy. I got stopped out at 88.5 which was my 2 point trailing stop.

In a downtrend I usually trail my stop to 2 points above the high of the last 1 minute candle. This is a good way to trail a runner, but sometimes a little tight and it does get hit early.
 

Attachments

  • Wed 16th March 2011.JPG 1 min chart.JPG
    Wed 16th March 2011.JPG 1 min chart.JPG
    227.5 KB · Views: 3,020
Last edited:
Hi Mornington, good to see you watch these threads as well as ADVFN. Yes, 30+ trades per day, can be stressful, which is why I asked if anyone else was doing this? I am trying to get this down to about 20 trades a day, and be more selective. Using a 1 minute chart kicks out lots of entries. The 5 minute chart is much less frenetic.

I've read some of Al Brooks's stuff and he seems to be doing a lot of trades per day. He trades the ES and not the FTSE, which maybe offers fewer trades.
 
morning MC
🙂

I dont know if it will help you but I seem to trade about 2 or 3 times a day as on average ftse usually offers 2 'swings' per day

and like you I use 5min for set up and 1 min for entry etc
but I find volume is less than reliable
 
this is one of the days (expiry) I trade FTSE... always fun... perfect for a tick whore 🙂

I have a new strategy for the roll I'm trying as well
 
morning MC
🙂

I dont know if it will help you but I seem to trade about 2 or 3 times a day as on average ftse usually offers 2 'swings' per day

and like you I use 5min for set up and 1 min for entry etc
but I find volume is less than reliable

Yes MC, I would like to do more swing trades, but that might be easier when I increase from one contract to two or three, and let one or two be runners. I very rarely have a trade lasting longer than 10 minutes, and I have to learn the discipline to sit on my hands to watch a trade for 25 to 50 minutes for a swing trade to develop.

Double tops and bottoms offer good opportunities for swing trades, but I like to see some confirmation of the top or bottom before entering the trade. I don't know which is preferable, entering right on the top or bottom with a tight stop, or waiting for it to bounce off and enter on a 2 point break on the 1 minute chart. What do you do? Anyone else have a preference for entries at double tops and bottoms?
 
this is one of the days (expiry) I trade FTSE... always fun... perfect for a tick whore 🙂

I have a new strategy for the roll I'm trying as well

I have only traded options expiry on the sim and don't have the guts to trade it live. I am always amazed at how volatile it is at expiry. Sometimes the price spikes massively. I have noticed that usually after the spike it tends to drift back over the next hour. So maybe it is better to fade any spike. Good luck with your new strategy.
 
my strategy, such as it is, is to wait for any extreme movements in the roll (say 20 ticks mins) and take the other side... if necessary leg out once auction is over with. So it may be I get no fills. There's not really much in the book to the upside in the roll though!

don't think it wise to risk too much on this but 10 or 20 lots should be fun

of course I may end up regretting it!

earlier in the day, scalping outright is super duper easy cause it's so thin
 
alas.... I was too far away!

roll traded 56.5 though, then finishes at 43!

on and forget 20 lots, you'd have to do 2 and 3 lots max 😆
 
Hi My preferred market is FTSE, BUT working in the UK means that as I still have a day job it is difficult to find the time to trade.

I was doing 8am till just before 9am, scalping on a 5 minute chart (with a difference). I like the movement - it fits my style well.

Given the lack of time to concentrate I have moved to getting up a 5:30 am and trading the HSI (Hang Seng) futures after their lunch. The HSI is absolutely mental. The movement kind of fits my strategy though, as volatility is the main requirement.
 
Good luck with the HSI, Tubbs. I struggle to get up at 5:30am. Not because it's early, but because I have a 1 yr old and a 4 yr old, and I really need the luxury of a lie in until 6:30am! I can't wait till they become teenagers and sleep till noon.
 
Just some observations today.

Firstly, it was options rollover for the FTSE this morning. Which means everyone had jumped to trading the June contract. The ES had already made the jump on monday. I didnt have the time yesterday, but it means transposing all of my support and resistance levels from the March contract charts to the June contract. I really only find the last 5 days s/r levels from the 1 hour chart of any use, and then I add the major tops and bottoms from the daily chart along with the fib retracements of those major levels.

It was a good morning to sit out the first 20 minutes. The price action was unconvincing, and it was a day of using small 4 and 5 point targets on scalps and being happy with it. Fridays are usually small target days, but the last few weeks have been much more active.

The options expiry at 10:15am was volatile as usual, but didn't offer much in the way of major divergences from the ES and FESX. It was followed by a nice slow slog from the lows of the expiry up to the high prior to expiry, almost 30 points. Then it had a sudden rush of euphoria when the Libyans announced a ceasefire. The market actually believed Gaddafi, and spiked about 25 points before it realised that Gaddafi might be lying.

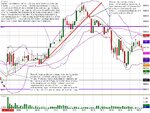
I have attached a chart showing the opening hour and the trades worth taking. The breakout of the opening range was nice, and after that the trendline break, but in general it was a quiet day, except of course for the Libyans.
 

Attachments

  • Fri 18th March 2011.JPG 1 min chart.JPG
    Fri 18th March 2011.JPG 1 min chart.JPG
    257.6 KB · Views: 1,421
Back
Top