Purple Brain
Experienced member
- Messages
- 1,613
- Likes
- 180
This thread is intended to allow anyone trading forex to discuss trades they are actually planning on taking or have just taken: The rationale behind the trade, the setup conditions, the entry, on-going management of the trade and the exit.
There is an excellent thread run by Lord Flasheart here: Live Trading and General Chat Lounge which provides traders the ability to make quick calls on trades they are making and that thread is highly recommended to those who simply want to log their live trading action without getting into the details.
This thread is more interested in the thinking behind the entries and exits and in-play modifications to the trade than verifying the realities of the actual trades called. It'll be up to each individual to ascertain how truthful anyone's entry and exit levels are and by all means call someone if you think they are mistaken, but for my purposes I'm more interested in the thinking behind each trader's actions for each trade.
It's totally unimportant how much money you made or lost in any trade. That's your business. What would be interesting though is to know for each trade how many pips you risked to make the pips you made. I'm really into R:R rather than absolute P&L.
I trade the 15 minute chart. I take purely directional trades. My bias is determined by the slope of a longish moving average 130 periods and the price in relation to that. The price has to be the 'right' side of that moving average which discounts me taking any major reversals.
I also have a 49 moving average which also needs to be the 'right' side of the longer term average. The price needs to be the 'right' side of the 49 average and I'm looking at it to pullback to the 49 average to see it there is any support. This, more often or not, occurs if there are other technical support/resistance levels at that point. Who'd have thought.
If the level does show support and I get an indication the reversal has been temporary and there is renewed momentum to the underlying bias, AND if I get entry signals (explain those as I go along) I'll go in.
I'm also experimenting with reactions to an even smaller moving average - the 17. This seems to be useful with the stronger underlying trends where the pullbacks are less likely to come all the way back to he 49.
I endeavour only to short from a lower high and go long from a higher low. I say endeavour as I frequently forget this small, but important factor in the excitement of getting a setup and signals.
I am certain there are other things I do that I don’t know I do, but as and when I discover them I’ll add them to this post (site staff support permitting of course) as it’ll make for an easier read than having to trawl through the entire thread.
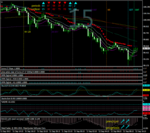
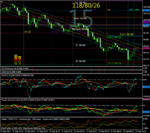
Attached are the charts I work from.
Chart-1: Long term (2 days) view giving me context for bias. One screen.

Chart-2: Entry related factors.

Chart-3: Exit related factors.

Chart-2 & Chart-3 sit side by side on one screen.
Chart-4: Rankings – The relative strengths of the individual currencies. One screen.

Chart-5: Signals – entry & exit signals for the 28 major crosses which I use to trigger trades that have valid setups ascertained from Charts 1-3 and after a quick peek at Chart-4 for a sense check. One screen and me squinting really hard.

There is an excellent thread run by Lord Flasheart here: Live Trading and General Chat Lounge which provides traders the ability to make quick calls on trades they are making and that thread is highly recommended to those who simply want to log their live trading action without getting into the details.
This thread is more interested in the thinking behind the entries and exits and in-play modifications to the trade than verifying the realities of the actual trades called. It'll be up to each individual to ascertain how truthful anyone's entry and exit levels are and by all means call someone if you think they are mistaken, but for my purposes I'm more interested in the thinking behind each trader's actions for each trade.
It's totally unimportant how much money you made or lost in any trade. That's your business. What would be interesting though is to know for each trade how many pips you risked to make the pips you made. I'm really into R:R rather than absolute P&L.
I trade the 15 minute chart. I take purely directional trades. My bias is determined by the slope of a longish moving average 130 periods and the price in relation to that. The price has to be the 'right' side of that moving average which discounts me taking any major reversals.
I also have a 49 moving average which also needs to be the 'right' side of the longer term average. The price needs to be the 'right' side of the 49 average and I'm looking at it to pullback to the 49 average to see it there is any support. This, more often or not, occurs if there are other technical support/resistance levels at that point. Who'd have thought.
If the level does show support and I get an indication the reversal has been temporary and there is renewed momentum to the underlying bias, AND if I get entry signals (explain those as I go along) I'll go in.
I'm also experimenting with reactions to an even smaller moving average - the 17. This seems to be useful with the stronger underlying trends where the pullbacks are less likely to come all the way back to he 49.
I endeavour only to short from a lower high and go long from a higher low. I say endeavour as I frequently forget this small, but important factor in the excitement of getting a setup and signals.
I am certain there are other things I do that I don’t know I do, but as and when I discover them I’ll add them to this post (site staff support permitting of course) as it’ll make for an easier read than having to trawl through the entire thread.
Attached are the charts I work from.
Chart-1: Long term (2 days) view giving me context for bias. One screen.

Chart-2: Entry related factors.

Chart-3: Exit related factors.

Chart-2 & Chart-3 sit side by side on one screen.
Chart-4: Rankings – The relative strengths of the individual currencies. One screen.

Chart-5: Signals – entry & exit signals for the 28 major crosses which I use to trigger trades that have valid setups ascertained from Charts 1-3 and after a quick peek at Chart-4 for a sense check. One screen and me squinting really hard.

Last edited by a moderator:
