Key To Markets - Discussions

KeyToMarketsUK

Well-known member
Messages
436
Likes
0
Hello everyone!

I am the representative of Key To Markets UK.

I have created this thread to offer my assistance and reply to your questions or doubts regarding Key To Markets.

Feel free to ask anything!

Regards
 
Are you regulated by the FSA?

Hi, the FSA (Financial Services Authority) has been replaced in the UK from April 2013 by the FCA (Financial Conduct Authority).

Yes, we are regulated by the FCA (UK) and FSP (New Zealand).

You can check our regulations here on our website.
 
Hello everyone.

On our blog we regularly publish fundamental and technical analysis regarding the main Forex paris, commodities and indexes we offer.

EURUSD-Net short positioning in EUR rose

EURUSD snaps the two weeks downtrend at lower Bollinger band earlier fails at breakout level. Following a weak NFP data (Apr07) the U.S dollar rejected at three-month descending daily trendline on Monday session. French election campaign officially started on Monday (April 10) may expect some risk during this week. As Marine Le Pen’s low probability of victory, we expect the risk will be on the higher side this short week.

FX positioning
Nomura (April 07)-Leveraged funds’ net short positioning in EUR rose after declining for three consecutive weeks (to 40% vs. 36% last week). Max net shorts in the last year stands at 75%, which was last seen in August 2016. Asset managers’ net long positioning in EUR fell to 26% vs. 28% last week.

Review
• February 2017, French manufacturing output continued to decrease for the third month in a row -1.6%
• Germany foreign trade balance recorded a surplus of 21.0 billion euros in February 2017
• Germany production in industry was up by 2.2% in February 2017
• Eurozone unemployment rate decreased in February to 9.5% from 9.6%.
• Final services PMI revised downward from 56.5 to 56.0
• Manufacturing PMI at 56.2 at near six-year high as growth accelerates in Germany, Italy and France

Technical analysis:
EURUSD flat on Monday session snaps the two-week downtrend manages to hold the lower daily Bollinger band.
The price breakdown the three-month ascending trendline extend the decline of 50% retracement of the 1.0339-1.0905 rally.
The daily BB finds at 1.0570 and 61.8 fib finds at 1.0550 below these 1.0490 Feb 22nd low exists. We expect the price likely to find support between 1.0570 and 1.0500 expect a retracement to 1.0650 and 1.07.
Alternatively, further downfall expected below 1.0490 to 1.0450, 1.04 and 1.0360 levels. Potential resistance seems between 1.0680 and 1.0720 levels.

EURUSDDaily.png
 
EUR/USD - Range trading expected ahead of the French election

Risk sentiment remains the key theme for the week ahead besides, French election looming.

Fundamental Analysis

Past Events review:
  • In March 2017, French consumer prices rose by 0.6% over a month and by 1.1% year on year
  • The Germany CPI rose by 0.2% in March 2017, on y/y basis 1.6% higher in March 2017.
  • German Economic Sentiment Continues to Improve. The indicator now stands at 19.5 points, thereby reaching its highest level since August 2015.


Upcoming Key Events:

Wed April 19:
  • Final EA CPI y/y forecast 1.50% vs 1.50%
  • EA Trade Balance forecast 18.6B vs 15.7B
  • Scheduled speech of ECB Executive Board Members’s Coeure and Praet
    During this forum a view on monetary policy may be presented.
    The market will be looking for further clarification on the ECB’s appetite for policy normalisation following recent dovish rhetoric that has weighed on the EUR.

Fri, April 21:
  • PMI readings.

ISTITUTIONAL FORECASTS:
Barclays (April 16):
A moderation in euro area flash PMIs is likely to be the focus in an otherwise quiet week and should weigh on the EUR. We forecast the composite PMI drop to 56.1 in April from 56.4 (consensus: 56.5), driven by some consolidation in French confidence. Final euro area March inflation (Wednesday) is widely expected to be confirmed at 1.5% y/y for the headline measure and 0.7% y/y for core.
We would expect the USD to remain under pressure this week versus the JPY, EUR, CHF and GBP.

CITI FX:
French election looming, so investors may be reluctant to take positions. This is likely to see range trade in EUR in the days ahead, with some scope for downward drift.

Technical Analysis​

As we can see in the 4 hours chart, the Eur/Usd extended the decline around nearly the 61.8% retracement of the 1.0339-1.0905 rally.
The near-term trading range remains between 1.07-1.0550 levels.
The price failed to handle 50Dsma twice, but remains above 20Wsma which is next support available.
Watching at the daily chart we can assume that the next potential supports are at 1.0599 and 1.0550 with further downfall expected to 1.0500/1.0490 and 1.0450 levels. Alternatively, potential resistance seems between 1.0680 and 1.0700.

EURUSDDaily.png
 
EURUSD-Market participants focus shifts to ECB policy. EURUSD breakout again


The results of the first round of French Presidential elections were very much in line with market expectations, EUR spikes. Market participant focuses on ECB meeting this week, the second round of the French election to be held in two weeks time.

Fundamental analysis​

Review of the previous data:
• The Ifo Business Climate Index rose to 112.9 points in April from 112.4
• Eurozone Manufacturing PMI 56.8 vs 56.1 forecast
• Eurozone Services PMI 56.2 vs 56.0 forecast
• Germany Manufacturing PMI 58.2 vs 58.1 forecast
• Germany Services PMI 54.7 vs 55.5 forecast
• French Manufacturing PMI 55.1 vs 53.2 forecast
• French Services PMI 57.7 vs 57.2 forecast
• EA annual CPI y/y was 1.5% in March 2017, down from 2.0% in February
• Euro area international trade in goods surplus €17.8 bn in February 2017, €1.7 bn surplus for EU.

Upcoming data:
Thursday, April 27
• Germany prelim CPI m/m basis forecast -0.1% vs 0.2%
Unicredit: The headline inflation rate in April likely accelerated by 0.3pp to 1.9% yoy.

• ECB meeting:
Thursday’s ECB policy meeting is unlikely to be eventful as ECB to keep policy accommodative.
Unicredit- We do not expect new policy announcements, nor do we anticipate any material change of rhetoric.
Unicredit: we think that Thursday’s meeting will be used by the ECB as a “bridge” to the June rendezvous, which promises to be important”.
Deutsche Bank: We do not expect any significant changes at the ECB meeting.
According to Abhishek Singhania at Deutsche Bank, “We do not expect any significant changes at the ECB meeting as the ECB is still waiting for credible evidence for improvement in underlying inflation and is unlikely to want to signal any change in policy stance as yet”.
ABN AMRO: Sticking to its stance for now
According to Nick Kounis and Aline Schuiling at ABN AMRO, We do not expect the ECB to make major changes to its communication at its meeting this week. The first step in the exit process will come with a change in communication in our view in June of this year. The forward guidance will likely become more neutral, dropping the explicit possibility of cutting rates or stepping up QE. We then expect the ECB to set out its plan for tapering in September of this year.
Nomura: We are in line with the consensus in expecting all the ECB’s key policy parameters
to be left unchanged at this week’s ECB meeting on 27 April. No change in the forward guidance may be a small disappointment for the market.
ING: Assuming that Macron does secure the presidency, speculation will increase of a significant tapering announcement to be made at the June 8th ECB meeting.

INSTITUTIONAL FX POSITIONING​
Nomura-EUR: Leveraged funds’ net short positioning in EUR rose for the third week (to 48% vs.
45% last week). Max net shorts in the past year reached 75%, which was last seen in August 2016. Asset managers’ net long positioning in EUR remained stable at around 21%.

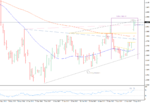
Technical Analysis​

The first round of French election sends the EURUSD to a five-month high.
EURUSD marches to the key breakout zone remains between 1.0950 its top of the rising channel and 1.1000 its 100Wema.
The price is trading above 50Wsma for the first time since November 2016 pause the rally at 20Msma seems at 1.0950.
The price gave an upside breakout through inverse H&S pattern on April 18th again breakout given yesterday (April 25)
The daily RSI approaching overbought zone, indicating round number 1.10 likely to act resistance over near term.
If this week closes above 1.1020/1.1030, rally might extend to 1.1100/1.1120 100Wema, 1.1200/1.1240 Oct 2016 high,1.1300 and 1.1400/1.1430 100.00 weekly fe over the medium term.
Symmetrical triangle breakout gave on the weekly chart, aiming at 1.1300 levels.
Support finds at 1.0900, 1.0820/1.0800 and 1.0700/1.0670
The French election risk was minimized notably, euro remains a buyer on a dip

UBS: forecast 1.15 and 1.20 into end 2017/early 2018
Societe Generale:The bottom in EUR/USD is behind us and the trend has turned.
Nomura: The possible dip after the ECB meeting and inflation data later this week may provide a good opportunity to buy EUR.
EURUSDDaily.png
 
The Key To Markets BLOG​

I'm here to announce you that we have a brand new blog where we provide:
- Daily Analysis.
- MT4 Tutorials.
- Much more.

Capture.PNG
 
Key To Markets is on MyFxBook​

Traders!

Key To Markets is now on MyFxBook.

You can check our raw ECN spreads and our institutional pricing in the broker comparison tables.

Capture.PNG

Check it out!
 
AUDUSD- The cross consolidating at 100WEMA.

  • AUDUSD has been grinding down for more than two months.
  • The cross down nearly 4.5% from March high’s.
  • AUDUSD low made at 0.7367 consolidating at 61.8 fib (Dec-March rally)
  • AUD remains under pressure amid still-subdued inflation and continued downside risks to iron ore prices.

Fundamental news

Australian building approvals and NAB business confidence scheduled today on Asia trade. Besides, China Trade Balance due.

ANZ– Forecast Residential building approvals fell 5.7% m/m in March.
“ANZ expects that business conditions remained elevated through April, and may nudge higher from already strong levels”.

Westpac– Australia March dwelling approvals (11:30 am AEST) are expected to fall 4% m/m (Bloomberg consensus), consistent with the underlying slowdown.


  • Tuesday, May 09
    - Retail sales forecast 0.3% vs -0.1%
    According to Jo Masters at ANZ, “Retail sales are expected to bounce back somewhat from February’s surprise fall, but the overall picture remains one of challenging times”.
  • Wednesday, May 10
    - Australia Annual budget

China economic events

  • Monday, May 08
    - Trade Balance
    Westpac– Both exports and imports have been growing strongly lately and the trade surplus has been large (>$40bn) aside from in months impacted by the lunar new year holidays.
  • Wednesday, May 10
    - China inflation y/y basis
    Scotiabank: AUD remains the only notable net long.
    Barclays: AUD remains under pressure amid still-subdued inflation and continued downside risks to iron ore prices.
    Societe Generale– A pullback in AUD/USD is underway and the pair could drift towards 0.73, which happens to be the lower limit of a broad triangle.
    Nomura– FX sensitivity to further declines from current levels is likely to increase as terms of trade shifts begin to weigh more heavily on the likes of AUD.

TECHNICAL VIEW​

AUDUSD drifts below 100WMA last week manages to close tad above.

The cross holds the 61.8fe on the weekly chart, below this 0.73 exists.

Resistance seems at 0.7440, 0.7490/0.7500 and 0.7560.
 

Attachments

  • AUDUSDWeekly.png
    AUDUSDWeekly.png
    24.2 KB · Views: 489
Last edited:
• Oil is yet to find a bottom.
• Oil nearing capitulation.
• Oil prices have fallen nearly 19% between mid-April to last Friday (May 05).
• On a daily closing basis, oil prices have fallen by around 10% on May 04 and 05.

FUNDAMENTAL NEWS​
Concerns over growth in China triggered the sell-off across various assets like copper, iron ore and oil.
The weak China April PMIs show early signs that growth in China is decelerating.

Brent has been trading below 50$ since May 04, for the first time since 30 November 2016, the day of the last OPEC meeting.

OPEC meets in Vienna on 25 May.
Market participants focus on May 25th OPEC meeting. Earlier on November 30, 2016 OPEC reached its first deal to cut oil production since 2008. The deal cut oil production from OPEC members by 1.2 million barrels a day.

OPEC ministers will meet in Vienna on May 25 (Thursday) to review the agreement and potentially extend the oil production cuts, over until the end of 2017.

• According to Alex Lawler and Rania El Gamal at Reuters, “OPEC and non-OPEC oil producers look likely to extend their agreement to limit supplies beyond its June expiry to help clear a glut, three OPEC delegates said on Thursday, downplaying the chance of additional steps such as a bigger cut”.

• According to analysts at Goldman Sachs commodity research, “Oil nearing capitulation “.
The analysts also said, “Given the lack of any significant oil data releases on the day, we see two forces at play in this sell-off:
(1) a follow through on the sharp declines in copper and iron ore the day before on concerns over growth in China, and
(2) once again, the influence of technicals and positioning, this time likely driven by negative gamma
effects and timespread liquidation.”

• According to Mark Ozerov at Goldman Sachs International, “we expect continued inventory draws to push the curve into backwardation, and ultimately lead to a sequential recovery in oil prices”.

Reuters Inside Commodities reported, “Saudi Arabia's energy minister Khalid Al-Falih said on Monday that oil markets were rebalancing after years of oversupply, but that he still expected an OPEC-led deal to cut output during the first half of the year to be extended to all of 2017.The Organization of the Petroleum Exporting Countries (OPEC), of which Saudi Arabia is the de-facto leader, as well as other producers including Russia, pledged to cut output by almost 1.8 million barrels per day (bpd) during the first half of the year to prop up the market. But ongoing high supplies have resulted in crude oil prices falling back below $50 per barrel”.

Drilling activity
According to the latest Baker-Hughes data, US oil drilling activity increased for the 16th consecutive week. The Rotary Rig Count (May 05) rose six to 703 last week was 697.

Positioning
• Standard Chartered Bank- Money managers are more negative on crude oil than at any point since the November 2016 OPEC meeting.
• SEB- IMM data from CFTC’s Commitment of traders report (Apr 26- May 2), Specs scaled down on their net long position for a second straight week. Meanwhile oil prices continued to fall and much sharper than the limited cut in the long position. Continued downscaling expected.

TECHNICAL VIEW​
Brent drift to 46.30$ on May 05 Asia session, recovered to 49.29$.
Parallel support finds at 45.90 Nov 29th low below this 45$ Sept 20th low exists.
The price manages to hold the trendlines as shown in the below chart.
BRENTDaily-1.png
Fails to hold 45.90, selling accelerates to 45$, 44.20/44$ initially, later 43.50/43.30$ possible.
Daily RSI indicates an oversold position.
Weekly trading range likely to remains between 51$ and 45.90$.
Ahead if the may 25th meeting, potential support finds between 44.20$/44$-43.50/43.30$.
BRENTH1-1.png
For the trading purpose, resistance zone remains between 49.60$ and 49.80$.
Bulls fell comfortable if settles above 50$ mark aims at 50.40$ and 50.80$.
Alternatively, support finds at 48.20/48$, 47.50$ and 46.95$.
 
COPPER- Bargain hunting expected.

COPPER- Bargain hunting expected.​

  • Copper price has been consolidating at 200DEMA for three sessions.
  • Price erases the ten-day descending trendline.
  • Trading at a four-month low, off- 13% from Feb2017 highs.
  • On the weekly chart, 100WEMA finds at 2.47

FUNDAMENTAL NEWS​
Standard Chartered: We believe that the refined market will tighten in H2 this year and that China’s net refined import volumes will rebound into mid-year. Ex-China refined copper market likely to tighten from mid-year on higher China import volumes.
Reuters reported, Both Sumitomo Metal and KGHM reported losses and booked writedowns on the project earlier this year, and in March KGHM said the second phase was on hold.
"In the current macro conditions, the second phase has lost sense," KGHM CEO Radoslaw Domagalski-Labedzki said at a news conference in Poland on Monday.
CFTC positions weekly: Speculators holding the COMEX copper futures and options net long positions increased by 11,389 contracts to 51276 contracts, a three-week high.

TECHNICAL VIEW​
The Copper price rose 0.20% on Asia trade. After a couple of months losses the price consolidating at a crucial support zone as shown on the best low chart.
U.S dollar rebounds last two days, caps the copper price over near term.

COPPERDaily.png

Potential support finds at 2.4465 and 2.4710/2.4700.
On the weekly chart, 100WEMA finds at 2.4709, as of now low made at 2.4712.
The price respects the descending falling wedge.
Resistance seems at 2.5550, 2.6000 and 2.6240

COPPERH1.png

Fails at support zone 2.4710-2.4700, Jan 2017 low 2.4688 exists.
Selling accelerates below Jan 2017 low, aims at 2.45 it’s 50.0% retracement and it's 61.8% at 2.3540 below these 2.4060 and 2.4000 its 50WMA exists.
Over near term trading range remains between 2.4700/2.4688 and 2.5550.
Trade: We expect the price likely to rebound around 2.4700/2.4688 if not focus shifts to 50.0% and 61.8% retracement levels. Bargain hunting expected.
 
Last edited:
Gold: Implied volatility has eased towards 2005 lows.

Gold: Implied volatility has eased towards 2005 lows.

• Gold price tested the four-month trendline.
• The gold price has a key support level finds at 1200$, but fell below 100DMA.
• Implied volatility has eased towards 2005 lows.
• Gold price increasingly oversold, RSI at 30.
• Past three hikes painted a low for gold prices.

FUNDAMENTAL NEWS

Gold price selling accelerates following FOMC statement (May 03) as a June hike remains a strong possibility.
After three weeks of selling, the daily RSI fell to 30 trading below all daily moving averages. Past three hikes, giving a hint of selling before the FOMC meeting.

Standard Chartered: We have marked to market our gold price forecast, but still expect Q2-2017 to be the strongest quarter for gold.
In a research note Standard Chartered reported, "We are more positive on physical demand for the remainder of the year". In detail, “There were three main takeaways from the Q1-2017 World Gold Council (WGC) Gold Demand Trends report: (1) jewellery demand was weak, but the remainder of the year no longer looks as weak as we had feared at the start of 2017; (2) central bank buying has slowed; (3) the scope for mine supply to grow much more quickly is limited at current price levels”.

According to Michael Riesner and Marc Müller at UBS, “On a very short-term basis we can see a bounce since gold is increasingly oversold but all in a we would see a bounce just as a beginning of abasing process into later May, where we have our next bigger multi-month cycle low projection as a set up for starting its next rally leg into summer”.

TECHNICAL VIEWS​
The price settles below four-month ascending trendline, parallel supports remains in focus.
On the weekly chart, 100MA finds at 1209 below these 1199.80 and 1191 exists.

XAUUSDWeekly-1.png

On the daily chart, Parallel support finds at 1194.80 and 1180$.
On the monthly chart, 100MA finds at 1197.
Over medium-term, price has a potential support zone remains between 1210 and 1180, we refer this as “buying zone”.

XAUUSDDaily-1.png

In case of deep correction, weekly lower Bollinger band finds at 1160$.
Resistance seems between 1236, 1240 and 1247$.
Bargain hunting expected.
 
April jobs data (May 18) is the key driver to AUD in the coming week.

AUDUSD has been consolidating at lower levels for three straight sessions. The cross is trading below all moving averages at all major time frames.

FUNDAMENTAL NEWS​

The week ahead
Market participants focus on RBA minutes and April jobs data. From China, Industrial production and fixed asset investments are due.
Mon, May 15
• China Industrial production y/y basis
• Fixed asset investments ytd/y
Tues, May 16
• Minutes of May 2017 Monetary Policy Meeting of the Reserve Bank Board 16 May 2017, 11.30 am AEST.
Wed, May 17
• Wage price index q/q basis
Deutsche Bank: we look for a modest tick-up in wage growth, with the quarterly change to round-up to 0.6%qoq in Q1, though this leaves year-ended wage growth at the low of 1.9%
Thurs, May 18
• April jobs data, the key driver to AUD in the coming week.
Deutsche Bank: we expect an increase in employment of around 20k. Consistent with this, we expect the unemployment rate to move sideways at 5.9%.

Central Banks divergence: RBA likely to remain on hold until 2018 while the Fed hikes rates further.

According to Wells Fargo, "Commodity prices have also become less supportive for the Australian dollar, while Chinese economic developments could have a varying influence on the currency over time. Positioning and technical factors suggest scope for further weakness".
Nomura: Expecting AUD continued underperformance

FX Positioning:
Deutsche Bank: AUD longs were pared (data from May 09).
Wells Fargo: Speculative Australian dollar long positions were pared back to 40,600 in early May from 55,300 in early April. (Source: Bloomberg LP, Wells Fargo Securities)

TECHNICAL VIEWS​

Consolidating at lower levels for three straight sessions.
AUDUSD technicals are extremely negative.
Support finds at 0.7360, 0.7330 (50.0 fib Jan-April, 2016 rally) and 0.7300.
Additional support finds at 0.7280 (80.0 fib Dec-March rally).

AUDUSDWeekly-2.png

Fails to hold additional support, 0.7200 and 0.7160 (December 2016 low) exists.
Resistance seems at 0.7425, 0.7470 and 0.7500/0.7525
Potential resistance seems at 0.7500/0.7525 and 0.7630100WEMA.
Ahead of the April jobs data, 0.7330 and 0.7280 are the key support level to be in focus.
In case of rebound, 0.7500/0.7525 is the initial target.
 
DXY likely to rebound beyond 61.8% of 101.35-98.50 fall.

  • The dollar index retraced last week, helped by 50WSMA.
  • Likely to rebound beyond 61.8%.
  • Has formed a five wave decline.
As you see in the below daily chart, the dollar index completed the 5 wave decline in a falling wedge pattern. We expect a near-term bottom has formed, forecast a retracement beyond 100 level.

USDXDaily-1.png

As shown on the daily chart, the dollar index retraces more than 61.8% in the last two occasions. The fifth wave made a low at 98.48 fell from 101.35 (April 10) it’s 61.8% seems at 100.20.

Over near-term potential resistance seems between 100.20 and 100.60 its 100DMA, in between 100.50 exists earlier breakout level (shown on the below weekly chart). The price likely to pause around 100.40 and 100.50, shifts to a consolidation phase before further moving higher through descending daily trendline (black). In this case, 100.90/101 expected.

USDXWeekly.png

Support finds at 99, 98.70 and 98.50 over near term. In case bulls fail to hold 50WMA finds at 98.50, the daily 100.0 fe at 98 and 97.70 are the potential supports exists.

NUTSHELL-Until the price holds the 50WMA, retracement expected to 100.0 fe on the daily chart seems at 101.00 (blue rectangle).


It is important to always keep in mind the risks involved in trading with leveraged instruments.

What is your Technical View?
Do you have a different idea? Please leave us a comment and get an answer from our professional analysts.
 
Last edited:
Where do you expect the S&P 500 to be by Friday's close ?

The price is within a thin range between 3 resistances.

In this week we have 3 economic news on the calendar:
Capture.PNG

Depending on the outcome of this news we could see a breakout and open a position in its direction.

Capture2.PNG
 
errrrrrrrr yes ?

Is that an up or down then ?

C'mon lets get off the fence of ifs and buts and pick a figure.
 
errrrrrrrr yes ?

Is that an up or down then ?

C'mon lets get off the fence of ifs and buts and pick a figure.

What do you mean with "pick a figure"?

I'm sure that an experience trader like yourself would agree that "picking figures" doesn't grow your account, what makes your account growing (and that's our main goal) is:
  • Develop a plan.
  • Follow the plan.

As explained before my plan is:
Depending on the outcome of this news we could see a breakout and open a position in its direction.

What is your trading plan?
 
BRENT: Parallel resistance seems between 52.40 and 52.60

• Since touching an intraday low of 46.32$ (May 05), Brent oil price rebound more than 11%.
• Overnight oil price extends the rally further 3%, support by comments from Saudi Arabia and Russia Brent oil price pauses the rally at 61.8% fib(April12-May 05fall).
• Oil prices spiked after the energy ministers of Saudi Arabi and Russia jointly said that an OPEC-led crude production would be extended until March 2018.

FUNDAMENTAL NEWS​
On Monday Asia session, Saudi Arabia and Russia agreed to extend oil production cuts from mid of this year to March 2018, i.e further nine months.

According to the Reuters, “The timing of the announcement ahead of OPEC's next official meeting on May 25 and the statement's strong wording surprised markets, and the move will go a long way to ensure that other OPEC members and other producers who participated in the initial round of cuts fall into line”.

Ed Morse, global head of commodities research at Citigroup, said he sees a 60 to 70 percent chance of the 1.8 million barrels per day of current cuts becoming larger as the producer group extends their deal to March 2018, reported by CNBC.

Contrarian view: Robin Winkler Strategist at Deutsche Bank said in a note to clients on May 15 “News of a possible extension of OPEC production cuts is not material enough to lift the oil price sustainably”.

U.S. Energy Information Administration (EIA) estimates that OPEC earned about $433 billion in net oil export revenues. This represents a 15% decline in revenue, this was the lowest earnings for OPEC since 2004. EIA forecasts Brent prices to average $53/b in 2017 and $57/b in 2018, reported in the Short-term energy outlook published on May 08.

Market participants shifts to wait and watch mode to see what happens at the May 25 meeting.

OPEC meets in Vienna on 25 May.
OPEC ministers will meet in Vienna on May 25 (Thursday) to review the agreement and potentially extend the oil production cuts, over until the end of 2017.
Earlier on November 30 2016, OPEC reached its first deal to cut oil production since 2008. The deal cut oil production from OPEC members by 1.2 million barrels a day.

TECHNICAL VIEWS​
Following Saudi Arabia and Russia announcement, adding fuel to the rally, oil price spikes 3% but fails to rally further. The bull's strength was sapped after rebounds more than 11% from early May lows.

The Brent Oil price rejected at 100DEMA, off nearly a percent from intraday high. The daily RSI is confirming above 50, appears upward momentum remains in play over the short term. But on the hourly chart (H1 and H4) the RSI seems an overbought, as a result, in the price likely to re-test support levels over near-term basis.

BRENTH4-1.png

The price has support levels finds at 51.20, 50.80 and 50.40. Potential support finds at 51 its 20DMA and 50.80 below this risk available to the downside 50.40 parallel support on the four-hour chart and 50$ initially. If the bulls fail to handle 50$, further downward acceleration possible to 49.80 and 49.60.
The near-term projection likely to be on the downside as the trend offers legroom than headroom.

BRENTDaily-2.png

Alternatively, resistance seems at 52, 52.40 and 52.60 61.8% (April 12-May 05 fall). Bulls can feel comfortable only after crossing these hurdles decisively, especially 52.60 aims at 53 and 53.50/53.70.

Weekly trading range remains between 52.60 and 49.50. Bulls incorrigible situation emerges below 49.50.

It is important to always keep in mind the risks involved in trading with leveraged instruments.

What is your Technical View?​

Do you have a different idea? Please leave us a comment and get an answer from our professional analysts.
 
Top