treefrogfarm
Newbie
- Messages
- 2
- Likes
- 0
I've just subscribed to level 2 data and despite reading all other posts/faqs I'm not really any the wiser.
I understand the screen layout but my very simple question (hence the reference to "Janet & John") is, as a rough rule of thumb and no commitments etc, how is the short term price movement "guessed" at given the level 2 data.
In the very simple world I live in, does it mean that if Sell Depth > Buy Depth, then short time price tends to go down?
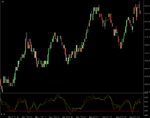
Or, being simplistic again, is it the 'V' shaped graph that says if blue line is lower than red line, then short term price tends to go down?
I know that the ultimate answer is "it depends", but a rough rule of thumb would be really appreciated.
Thanks
I understand the screen layout but my very simple question (hence the reference to "Janet & John") is, as a rough rule of thumb and no commitments etc, how is the short term price movement "guessed" at given the level 2 data.
In the very simple world I live in, does it mean that if Sell Depth > Buy Depth, then short time price tends to go down?
Or, being simplistic again, is it the 'V' shaped graph that says if blue line is lower than red line, then short term price tends to go down?
I know that the ultimate answer is "it depends", but a rough rule of thumb would be really appreciated.
Thanks