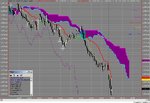
I am going to try to post what I do using the Ichimoku indicator. To read up on the basic methodology of how to use and understand the Ichimoku, this is the place to start:
http://www.kumotrader.com/ichimoku_wiki/index.php?title=Main_Page
and is by far the most authoritative site to learn from.
The posted chart traded today is live from Tradestation. I use the Kijun Sen (slower MovAvg) as the main indicator - if the close occurs above the Kijun the line turns red, otherwise it is green (thicker than the others). The Chikou Span (Delay Indicator) is colored as per the Senkou Cloud depending on if the price crosses above or below the Chikou. The Senkou (the Clouds) have two colors - a fill and an outline. As I mentioned in another post, this color arrangement often stops me from getting into trouble if I wait for the upper margin to match the body. The Cloud color changes will be discussed in a later post. This post is not an explanation of how I trade, nor is it trading advice, but just to get used to my color schemes. If we are successful in getting the pictures online, I will give my reasons and examples for the trades in further posts if there is interest - it is my actions alone and not advice on how to trade. I have to be honest - I use another indicator to confirm the entries (not just the Ichimoku alone) - this is heresy to the Ichimoku purists, but I am very insecure when it comes to losing my money. Perhaps I will post that combination at another time.
I trade S&P Eminis only. We can try to match the trades with FOREX if there is interest. I only use Tick charts. The Emini chart is set to 1200 ticks and is set to the CME based on CST. The chart is a 24 hour trading Globex chart. There are no other charts. Here we go.


