Trend angle?

MrNoodle

Newbie
Messages
3
Likes
0
I've seen trend angle mentioned in a few places, eg a 45 degree trend is a good angle.

I'm confused about this, as I can sharpen/flatten the trend angle by zooming in and out of a chart. Is there some sort of standard bar distance that gives a "normalized" trend angle?
 
You are quite right, trend angle is a function of scaling. However, what is of potentially greater value is a sharply increased angle compared with what has gone before.
Don't even think about measuring it, just eyeball it.
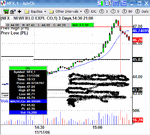
Look at this example. The trend moves up at an angle and then the angle becomes much steeper.
You will often find that after such a sharp increase, the reaction fall can be very fast as profit takers and shorters move in; just as in this example.
In many aspects of trading it is not so much a number per se, more how it compares with the norm or what has gone before.
In other words, a sharp difference is what matters, not an absolute number.
Richard
 

Attachments

  • 171106NFXdetailserased.GIF
    171106NFXdetailserased.GIF
    23.2 KB · Views: 793
Hi MrNoodle, so far as I know, it was the controversial trader WD Gann who introduced drawing Trendlines by Angle (TbA) when he was trading in the early 1900s.

TbAs are valid for the chart timeframe they're drawn on. In MetaStock for instance a TbA won't recale when the chart is zoomed, but both the Gann Fan and Fibonacci Fan will rescale.

While TbAs can be very accurate, I don't find them useful since too many of various angles and start points have to be drawn, I prefer using the Standard Error Channel.

Advanced GET has a Gann Box tool which can work quite well and at times appears to be a blueprint the Price follows. The Gann Box is a scaled Gann Fan -- see attached chart.
The angles used are: 1 X 4, 1 X 2, 1 X 1 (45 angle -- Red line), 2 X 1 and 4 X 1
for a more complete explanation see:
http://www.marketscreen.com/help/AtoZ/default.asp?hideHF=&Num=53
 

Attachments

  • g bx.png
    g bx.png
    37.8 KB · Views: 933
The angle will change constantly, I can't see much help there. If there are a lot of readings the angle will change less but then it will lag behind the price more and more.

For instance, Mr Charts shows a steepening trend towards the peak, Would not a trader be lulled into a sense of false security by that if he was using linear regression? He might be tempted into a premature short.

I suppose that a deviation, say double, the norm might alert him to a changing trend.

All the systems based on deviation fail me, at least, in the end although it is an interesting subject and I use it a lot.

Split
 
Top