Testing A New Stock Screening Stratey

Will Duxon

Active member
Messages
175
Likes
4
I'm a speculator—not an investor. Consequently, I regard FINRA RULE 4210 against pattern day trading as a regulation designed to keep me from making money in the stock market and therefore seek to avoid it by searching the exchanges just prior to the close in order to purchase stocks I can sell the next day at a profit.

My screening process relies on technical analysis, most recently using principles borrowed from insights gleaned while trading foreign currency pairs. In that tradition, I am ready to test a new filter to see whether it is worthy of inclusion among the two I already have in use.

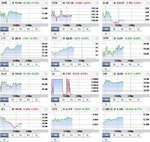
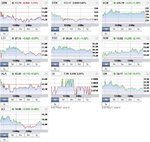
The securities that went on my watch list toward the end of Tuesday's trading:
ScreenHunter_4619 Oct. 04 20.50.jpg

SWN $13.74
Target Price: $14.05
Stop Loss: $12.85

RTN $137.17
Target Price: $139.15
Stop Loss: $134.44

AGN $235.78
Target Price: $242.20
Stop Loss: $227.43

LCI $27.10
Target Price: $29.79
Stop Loss: $26.15

I'll be interested to see how the above stocks perform in comparison with the following:

Screen #40:
TSO, SEM, ALR, GI
Screen #42: GM, KS
 
Last edited:
Already I can see that when it comes to stocks, I will not be using indicators (my proprietary envelopes) to set my Take Profit targets, as I do when trading currency pairs. (Also, with securities I do not adhere to the minimum 1:1 reward-to-risk ratio I follow when trading Forex.)

When it comes to equities, I'm happy with a 1% increase the next day. Up to a 3% gain is fine and dandy, and above that...I'm ecstatic.

ScreenHunter_4626 Oct. 05 10.25.jpg

Halfway through the New York session SWN is up 1.13% at $13.90, so the $14.05 target price was a bit higher than I needed for it to be.

LCI hit my target and then some, so at $28.11 (up 3.73%) I'd be happy to sell it right here.

TSO (from screen #40) is also up significantly (3.43%), so at $82.99, I'd be satisfied to lock in my profits here, though it looks like it has the potential to climb a lot higher before the day is through.

At $32.68, GM (from screen #42) is up 1.60% from yesterday's close at $32.17. As for the two securities from my test filter that are not up a minimum of 1% (RTN and AGN), they are down only -0.07% and -0.05% respectively, so if I sold all four stocks right now (which is what I would do had I actually made the trades) I would be walking away with a net profit.

Nonetheless, I will continue to follow today's "losers" to determine whether this new screen highlights equities primed to make up temporary losses over the next week or two, or if they are destined to experience further declines and deserve to be abandoned immediately.
 
Last edited:
There's about an hour left before the closing bell and SEM has made some significant strides:

ScreenHunter_SEM.jpgScreenHunter_KS.jpg

However, KS is down more than 5%, which does not bode well for Screen #42.
 
Wednesday's End-of-Session Selections:

The stocks highlighted by my test screen 15 minutes before the close of today’s session were: AFL, NVS, FAF (I don’t like the looks of this one), BXS and DECK.

Screen #40 is designed to seek out stocks that are more or less attempting a “comeback,” so the list is exactly the same as yesterday: TSO, SEM, ALR and GI.

Screen #42 returned ENH, IGT, PAG and SHOP.

For the time being, I'm going to place my stops at 2% below the closing price.
 
Morning Analysis

Today is the kind of day I hope for when testing a new stock screen. (It’s kind of hard to tell how much “fortitude” a given filter possesses if the market is making gains every day.)

The first thing that struck me is that even though Screen #42 had a very poor performer out of just two picks yesterday, the four it chose for today are holding up relatively well on a somewhat gloomy morning. It's bout two hours into the NY session and the Dow, S&P and NASDAQ are down -0.48%, -0.26% and -0.39% respectively—yet ENH, PAG and SHOP are down only -0.08%, -0.22% and -0.16%, and IGT is actually up 0.16%

Moreover, KS (yesterday's disappointing "loser") is making an admirable attempt at a recovery from yesterday’s plunge as it is currently up 4.06% (from yesterday’s close) at $18.89.

Three of yesterday’s choices from the new test filter have continued to climb (SWN, RTN and AGN) though LCI has unfortunately taken a dramatic -4.57% dive. (The lesson there might be to make sure I cash in on dramatic launches when they happen.)

The stocks highlighted by the test screen for today are generally performing worse than the overall market, and the three from Screen #40, which carried over from yesterday, are doing absolutely terrible, with three out of the four down more than -1.00%.
 
Today I just began exploring the idea of only buying stocks on specific days, as dictated by the location of price within the overall structure of the S&P, NASDAQ and DJIA daily charts. But in the meantime...

Going back to yesterday...with a 1.5% Take Profit target and exiting positions with a 1% loss, here is what I find...

SWN could have been sold for a profit at $13.95 or above.

RTN is rising, but has yet to reach its $139.23 target (Stop Loss at $135.80)

AGN is rising, but has yet to reach its $239.32 target (Stop loss at $233.42)

LCI could have been sold when I said yesterday, while it was up 3.43%, far exceeding the profit target.

I don’t have Tuesday’s closing prices for most of the stocks that came from Screens #40 and #42 (and I’m not going to go back and look them up) but GM could have been sold yesterday when it was up 1.60% from $32.17 and TSO could have been sold at $28.99 when it was up 3.43%

I have no notes on SEM, so I’m not sure if it would have been sold for a 1.5% profit yesterday. If not, the position would have had to have been exited today at a loss. KS would have been exited yesterday, but the question I have is: "When these stocks from my list go on to tank 4%, does it make sense to get back in to “ride the rebound” evidenced in KS’s behavior today?" To help answer that question, I’m going to keep my eye on LCI.

Today I’m going to add the following equities to my list from the new screen, which is Screen #44, and I’m going to ignore Screens #40 and #42 for the time being:

MON $26.76
Target: $27.16
Stop loss: $26.49

KMX $52.78
Target: $53.57
Stop loss: $52.25

COO $178.69
Target: $181.37
Stop loss: $176.90

DECK (Already on the watch list from yesterday)

OSG $10.70
Target: $10.86
Stop loss: $10.59

Yesterday Screen #44 gave me the following:

AFL $71.90
Target: $72.98
Stop loss: $71.18

NVS $79.13
Target: $80.32
Stop loss: $78.34

FAF $39.51
Target: $40.10
Stop loss: $39.11

BXS $23.38
Target: $23.73
Stop loss: $23.15

DECK $60.81
Target: $61.72
Stop loss: $60.20
 
Hypothetical Results thus far (assuming 1% SL and 1.5% TP / Includes Screens #40, #42 and #44):

SWN: sold for a profit at $13.95
RTN: $139.23 TP target (Stop Loss at $135.80)
AGN: $239.32 target hit this morning about 30 minutes into the NY session
LCI: sold while up 3.43%
GM: sold when up 1.60%
TSO: sold when up 3.43%
SEM: I'll assume it had to be exited yesterday at a 1% loss.
KS: I'll say exited at a 3% loss

Thursday Screen #44 gave me the following:

MON: (Apparently the wrong ticker symbol)
KMX: Exited at a loss (Stop loss: $52.25)
COO: Target: $181.37 / Stop loss: $176.90
OSG: Exited at a loss (Stop loss: $10.59)

Wednesday Screen #44 gave me the following:

AFL: Target: $72.98 / Stop loss: $71.18
NVS: Exited at a loss (Stop loss: $78.34)
FAF: Target: $40.10 / Stop loss: $39.11
BXS: Exited at a loss (Stop loss: $23.15)
DECK: Target hit (Target: $61.72)
 
Last edited:
Another Angle

Too many picks are getting stopped out, so I'm setting aside Screen #44 to try something a little different:

WATCH LIST FOR MONDAY...

BHP, HLX, BRFS, BBL, PWR, ELLI
 
Last edited:
Could it be you are trading noise?

Yes it could. On the other had, I was told again and again that it is impossible to trade Forex successfully using one-minute charts because all you are doing is trading noise, and yet, I did so profitably from November 2015 up until a couple of months ago. What others saw as "noise" did not (for the most part) look random to me at all.

As it turned out, I was able to take what I learned trading one-minute charts and begin incorporating one-hour charts as well—a strategy I was so confident might be successful that I came to Trade2Win in August 2016 to begin documenting the system publicly as a means of embarrassing myself into honestly admitting I was wrong should it turn out to be unsuccessful and thereby keep from deluding myself.

I then began incorporating four-hour charts, and then daily charts, to where I am now using a multi-chart multiple-moving-average-envelope approach to trading foreign currency pairs that has not seen a losing day since it was finalized on September 27th.

Perhaps this is normal for experienced traders, but it is my first time using a system that virtually guarantees every trade I make is successful. So without question the answer is a definite yes, I might be trading noise, but my willingness to "think outside the box" and go with my own ideas ultimately paid off in the Forex market, so I am bringing that same mindset to equities, banking on the possibility I might again see things others appear to have missed, and as a result, encounter a level of success that—for me—is unprecedented.
 
Last edited:
Monday, October 10, 2016

Today's hypothetical results:

ScreenHunter_4671 Oct. 10 13.23.jpg

BHP sold @ $36.04 for a gain of 1.91%
HLS sold @ $9.59 for a gain of 4.69%
BRFS $17.89 (Stop loss $17.71 / Take profit $18.16)
BBL sold @ $31.57 for a gain of 2.00%
PWR $28.51 (Stop loss $28.22 / Take profit $28.94)
ELLI sold @ $103.68 for a gain of 1.50%

(Purchased prior to Friday...)

COO Target hit (Sold @ 182.24 for a gain of 1.98%)

Just noting to myself that if I had locked in gains by selling everything today, none of the securities would have subtracted from this alternative filter's (Screen #45) net profit. However, I won't get a true idea of its strength until a day when all the major indices are in the red.

The equities highlighted toward the of today's session were:

EWZ, NBR, OIL, SGMS, ILF, FET, DBO, PRTY, SRAQ

But here's what I'm really thinking..."go ahead and screen for stocks the same as usual every day using what you believe to be you most reliable filters (40, 42 and/or 45), but make no purchases until and unless the price of the S&P 500 falls below the 'magic' line (see the yellow dotted yellow line in the daily chart below)."

SPX500Daily.png

Of course, this would seriously reduce the number of days I'd be in the market, but it might also vastly increase the confidence with which I could count on all my picks proving me with a single day's profit of up to 4% and also justify my "investing" heavily on those days when I do opt to make purchases.

...in fact, I just decided, that's what I'm going to try next.
 
Last edited:
This is the kind of day I need for testing new screens. So far I like what I'm seeing.

ScreenHunter_4677 Oct. 11 07.18.jpg

At this point none of yesterday's picks are experiencing a whopping 3% or 4% loss and a couple of the assets (SGMS and SRAQ) are even in profit territory. I will have to keep my eyes on ILF, PRTY and FET to see if they can bounce back. If they eventually do so, I will probably have to adjust what I have currently set as an acceptable stop loss from 1% to 2%.

Technically, that would mean resetting my profit target to at least 2% as well, but when it comes to stocks, I'm not as inflexible as I am with currency pairs.
 
Just What the Doctor Ordered...

SPX500Daily.png

This is exactly what I said (yesterday) that I needed! As of 8:15 a.m. PST the S&P 500 has dropped below my "magic line," so I ran screens 25, 40, 42, 44, 45, 56 and 93, recording the current price and day change of each stock. (Screens 45, 61 and 94 did not return any equities.)

Now I need to see which of these stocks are in positive territory by the close of tomorrow's session, if any, and which provide the best opportunity to profit by exiting the position during an intra-day high at some point tomorrow.
 
Plumb Line Trading Strategy

SPX500Daily.png

Based on today’s highs…

Filters 45, 61 and 94 highlighted no equities.

Screen #25: Possible gains offered out of the 14 stocks were 1.2% from LLY, 1.5% from TSU, 2.0% from CNHI, 1.0% from ASB, and 1.2% from CIB. That’s only a third of the group. Moreover, only about half of these stocks are up from yesterday’s close. (n)

Screen #40: ALR and GI offered the possibility to exit with a 1% gain max. TSO did not. :sleep:

Screen #42: S offered the possibility of exiting with a 3.5% gain, and BAK with a 3.6% gain! :clap:

Screen #44: Possible gains offered out of the 12 stocks were 1.0% from TSN, 1.5% from ABC, and 1.6% from OMN. That’s only a fourth of the group. However 100% were up from yesterday’s close (actually, UVE was break even), totally eliminating the possibility of suffering a net loss. :p

Screen #56: Four of the eleven offered gains of from 1.3% to 1.9%. That’s only about a third of the group. However, all of them except one are up from yesterday’s close—minimizing any possibility of suffering a net loss. :p

Screen #93: ITC offered an opportunity to lock in gains at 1.9%. (y)

RESULTS: (Eliminate Screens #25 and 40.) This approach appears to have the potential to enable me to completely or almost completely avoid losses. However, today’s close was once again below the plumb line (see above chart, second candlestick from the right) so it will be interesting to see if everything falls apart in the face of a continued decline in the S&P. Here are today’s picks:

Screen #42: None

Screen #44: Ranked by Volume - ABC, STWD, MWA, AFL, PLD, ITC, WCN / Ranked by worst % Day Change – PHH, STWD, CCP, ITC, AFL, PLD / Ranked by best % Day Change – MWA, SUI, FAF, LXP, MGP, ABC, WCN, HIW, STAG, SKT, BRX

Screen #56: HCA, GIS, DG, SIX, CB, KAR, AWK, ASB, INXN, AZO, ELLI

Screen #93: ITC, VAL
 
Yeah baby!

The jury is in...the S&P500 sank back down to last months lows...

SPX500Daily.png

... and yet, if ranked by the stocks that managed the highest % day change yesterday, 73% of the assets highlighted by Screen #44 (now my favorite) are already in positive territory this morning, and NONE experienced a draw down of greater than half a percent:

ScreenHunter_4689 Oct. 13 08.03.jpg

Moreover, the equities selected by Screen #44 the DAY BEFORE also continue to climb overall:

ScreenHunter_4690 Oct. 13 08.34.jpg
 
Last edited:
My Crème de la Crème of Stock Filters

Yesterday's picks:

ScreenHunter_4693 Oct. 13 13.26.jpg

Tuesday's picks:

ScreenHunter_4694 Oct. 13 13.28.jpg

The Major U.S. Indices:

ScreenHunter_majorUSindices.jpg

Today's picks:

Some of these socks are holdovers from today. Also, today is not a "buy" day since the indices are no longer priced below the "plumb line." I traded stocks everyday between 2007 and 2010 testing what must have been thousands of different stock screen ideas, so hopefully I can tell when I have one worth keeping. This one I plan on keeping.

That said, this is the last time I will be listing stocks highlighted by Screen #44...

DOC, FCPT, HIW, EQC, STAG, STWD, INN, LXP, BRX, STOR
 
Last edited:
Yesterday's picks:

That said, this is the last time I will be listing stocks highlighted by Screen #44...

DOC, FCPT, HIW, EQC, STAG, STWD, INN, LXP, BRX, STOR

Out of curiosity I just checked the last stock selection I made (it was back on October 13th) and found that 100% of the equities had risen in value, so I will definitely be using the corresponding screening process into the future.

This will be my last entry posting on this forum. It was great motivation, but I think I've now improved about as much as I'm going to from the experience, so it's time to move on. Good luck to everyone!
 
Top