support and resistance

bertie123

Active member
Messages
115
Likes
2
Hi Folks,

A newbie speaking here. I was wondering how you work out support and resistance for different time frames? I am demo trading the forex and get confused when people talk about 'dynamic trendlines' and 'dynamic resistance' levels - what exactly are these and can you use indicators or do you draw them on manually yourself? When I look at one or two blogs which I follow for market analysis:confused: I cannot see the resistance levels which they talk about!:( Any thoughts\comments would be greatly appreciated!
Hi bertie

For me moving averages work really well as dynamic trend lines and s & r levels, using a pivot point calculator can be useful for the static levels if your charting package doesnt draw them for you.

http://www.daytradingcoach.com/pivotcalculator.exe

You can of course manually draw in trend lines and pivots points yourself if you wish but a bit tedious when these days its can all be done on the fly in the latest charting software. its just a case of adjusting the higher time frame MA to the trend and calculating the lower ones.

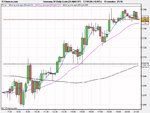
The example chart I've included was destined for another thread but that discussion has degenerated somewhat, so its here now:LOL:
Its a Dax chart (sorry not fx as you were asking about) showing 3 moving averages based on fib numbers, the black horizontal line is the pivot, red horizontal line is R1. Notice how the price reacts to these lines, its obviously better in realtime, its very interesting watching the price approach an MA or S&R level then bounce off it:cool:

Have fun with those FX charts and good luck.

cheers
Lightning
 

Attachments

  • DAX.jpg
    DAX.jpg
    201.5 KB · Views: 394
Hi Folks,

A newbie speaking here. I was wondering how you work out support and resistance for different time frames? I am demo trading the forex and get confused when people talk about 'dynamic trendlines' and 'dynamic resistance' levels - what exactly are these and can you use indicators or do you draw them on manually yourself? When I look at one or two blogs which I follow for market analysis:confused: I cannot see the resistance levels which they talk about!:( Any thoughts\comments would be greatly appreciated!


If you are interested in the classic definition of support and resistance, this thread will likely be of big interest:

http://www.trade2win.com/boards/showthread.php?t=20336
especially posts 5 and 83-92

It has however nothing to do with dynamic support & resistance levels.
 
Top