S/R and the Mirror of Erised

dbphoenix

Guest Author
Messages
6,954
Likes
1,266
erised stra ehru oyt ube cafru oyt on wohsi

NOTE from six months later: a sidebar exchange regarding trading S&R has been going on here -- http://www.trade2win.com/boards/showthread.php?t=22882 -- and some may find it at least as pertinent to their own situations, if not more so, as what is presented in this thread.

Db
 

Attachments

  • SR1.jpg
    SR1.jpg
    94.6 KB · Views: 1,433
  • SR2.jpg
    SR2.jpg
    31.5 KB · Views: 1,070
  • SR2.jpg
    SR2.jpg
    40.4 KB · Views: 929
  • SR2.jpg
    SR2.jpg
    43.7 KB · Views: 839
  • SR2.jpg
    SR2.jpg
    43.7 KB · Views: 752
  • SR2.jpg
    SR2.jpg
    43.9 KB · Views: 715
  • SR2.jpg
    SR2.jpg
    47 KB · Views: 756
  • SR2.jpg
    SR2.jpg
    47.1 KB · Views: 702
  • SR2.jpg
    SR2.jpg
    47.4 KB · Views: 706
  • SR2.jpg
    SR2.jpg
    48.6 KB · Views: 725
  • SR2.jpg
    SR2.jpg
    40.4 KB · Views: 817
Last edited:
Thank you J K Rowling.
She's certainly sold a lot of 'Volumes' but does she know about price ? :)
Glenn
 
:|
 

Attachments

  • SR2.jpg
    SR2.jpg
    38.7 KB · Views: 638
  • SR1.jpg
    SR1.jpg
    103.8 KB · Views: 654
  • Lows.jpg
    Lows.jpg
    33.4 KB · Views: 661
  • DV.jpg
    DV.jpg
    36.8 KB · Views: 802
  • Div.jpg
    Div.jpg
    66.2 KB · Views: 810
  • SR2.jpg
    SR2.jpg
    39.6 KB · Views: 559
  • SR2.jpg
    SR2.jpg
    36.4 KB · Views: 610
  • SR2.jpg
    SR2.jpg
    37.4 KB · Views: 603
  • SR2.jpg
    SR2.jpg
    38.3 KB · Views: 569
  • SR2.jpg
    SR2.jpg
    41.1 KB · Views: 581
  • SR2.jpg
    SR2.jpg
    44.9 KB · Views: 686
  • SR2.jpg
    SR2.jpg
    44.5 KB · Views: 598
  • SR2.jpg
    SR2.jpg
    46.7 KB · Views: 607
  • SR2.jpg
    SR2.jpg
    47.2 KB · Views: 619
  • SR2.jpg
    SR2.jpg
    53.8 KB · Views: 635
Last edited:
:|
 

Attachments

  • SR1.jpg
    SR1.jpg
    104.8 KB · Views: 654
  • SR2.jpg
    SR2.jpg
    43 KB · Views: 544
  • SR2.jpg
    SR2.jpg
    46.2 KB · Views: 568
  • SR2.jpg
    SR2.jpg
    46.6 KB · Views: 550
  • SR2.jpg
    SR2.jpg
    47 KB · Views: 574
  • SR2.jpg
    SR2.jpg
    47 KB · Views: 591
  • SR2.jpg
    SR2.jpg
    39.6 KB · Views: 572
  • SR2.jpg
    SR2.jpg
    39.9 KB · Views: 608
Last edited:
When working to locate potential levels or zones of support and resistance, it's important to focus on what Magee calls the "territory" -- the reality -- rather than the map, i.e., our representation of that territory. The territory is prices paid. Our maps are our representations of it: MAs, Fib ratios, MACD, patterns, price and volume bars, etc.

S/R are found where important buying/selling have taken place, important enough to have turned price. Therefore, the first place to look for S/R are those price points and/or price levels. Anything else -- e.g., a trendline -- is a representation, and that representation may have nothing to do with the reality, i.e., price.

"Importance" is defined as those levels or zones in which a relatively large number of trades have taken place. These trades need not have occurred on only one occasion. In a base, for example, when "big money" is accumulating shares, these trades take place over an extended period of time over a narrow range of prices. Therefore, all told, many trades have taken place even though "volume" -- i.e., trading activity -- has been low.

Many trades can also occur in a broader range over a period of time which may be shorter or longer than an accumulative base. For example, if a given level is hit repeatedly and price is "supported" there by professional buying, that level becomes strong support, even though the number of shares traded during any one occurrence are not impressive.

Ditto all of this for resistance. There will be a level at which shares or contracts or whatever are repeatedly sold, though the reasons for the sales may be difficult if not impossible to determine. These sales can take place in a "zone of distribution". Or they can take place over time when a particular level is repeatedly tested.

Support and resistance, then, can be found in a swing point or the top or bottom of a reaction, but it is highly unlikely that the support or resistance found there will be important as it doesn't represent enough previous trades. In other words, there just aren't enough traders who care about it to make it important.

For the same reason, whatever support and resistance seem to be found with indicators or trendlines are most likely coincidental since these other lines don't represent previous trading activity. In fact, they're constantly moving.

The term "law of reciprocity" or "principle of reciprocity" is sometimes applied to the tendency of support to become resistance when it's penetrated, or vice-versa. However, "law" and "principle" are a bit high-toned to apply to this concept. There is nothing absolute about S/R. In fact, S/R can be quite soft. For example, if a given level is tested repeatedly as support, those holders who bought there may eventually begin to become concerned over these tests and over the fact that whatever they bought isn't going anywhere. Some of them may decide to sell some of all of whatever they bought if and when another test occurs. In this way, support fails.

Even "failure", however, may not be as important as first thought. S/R isn't, and need not be, rigid. In fact, it is quite flexible. A level or line can be penetrated to what seems to be an intolerable degree, but if price rebounds to that level or line and finds S/R there yet again, then that level or line can become even "stronger" (more important) than it was before, which is why it's better to think in terms of S/R "zones" than of specific prices.

S/R may be too soft for some traders to fool with. However, if one understands that correctly-drawn S/R lines represent levels or zones in which a large number of trades took place, and that one can expect important action to take place at important S/R, he can then avoid wasting his time on relatively trivial trades and prepare himself to take advantage of more potentially profitable opportunities.
 
Last edited:
dbphoenix said:
Even "failure", however, may not be as important as first thought. S/R isn't, and need not be, rigid. In fact, it is quite flexible. A level or line can be penetrated to what seems to be an intolerable degree, but if price rebounds to that level or line and finds S/R there yet again, then that level or line can become even "stronger" (more important) than it was before, which is why it's better to think in terms of S/R "zones" than of specific prices.

Hi dbp,
Having read many of your offerings on these boards and, indeed, in your book, the concept of S/R being quite "soft" is something you emphasise quite a lot. Is there not a domino effect regarding the other key players in assessing the price/volume relationship? That is to say, if S/R can (or should) be regarded as soft, would it not be wise to also regard trend lines, demand/supply lines and volume as "soft"? If so, surely the whole process becomes a bit imprecise, vague, wishy washy and subject to personal judgement which, by its very nature, is not objective? This strikes me as being the very antithesis of your whole argument which is focused on assessing the markets in a (relatively) scientific, objective and unemotional fashion. If this isn't the case, then why is it that - for example - S/R is as you say "soft" and trend lines or demand/supply lines are rigid and precise? To summarise, is everything "soft" or are some things soft and other things hard? Oh dear, as I write this, I can sense the smut police getting quite agitated! :LOL:
Double entendre aside, my question is a serious one, I promise!
Cheers,
Tim.
 
I don't recall saying that trend lines and demand/supply lines are rigid and precise.

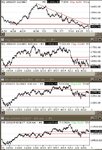
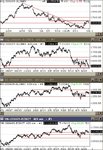
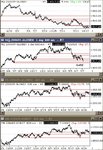
As for "imprecise, vague, wishy-washy" and so on, if you've reviewed the charts included in my first three posts to this thread, you'll note that you could have done very well over those three days by doing no more than focusing on S/R and doing what the market told you to do. On the other hand, the imprecise, vague and wishy-washy would have sat back, watched, and done nothing more than sigh over the coulda/woulda/shoulda.
 
Last edited:
dbphoenix said:
I don't recall saying that trend lines and demand/supply lines are rigid and precise.

As for "imprecise, vague, wishy-washy" and so on, if you've reviewed the charts included in my first three posts to this thread, you'll note that you could have done very well over those three days by doing no more than focusing on S/R and doing what the market told you to do. On the other hand, the imprecise, vague and wishy-washy would have sat back, watched, and done nothing more than sigh over the coulda/woulda/shoulda.

I'm not attacking you dbp, I'm merely trying to understand. So, if you've never said that trend lines, demand/supply lines are rigid and precise, is it reasonable to conclude that they - like S/R lines - are soft? A simple question, nothing to get all defensive about.
Kind regards,
Tim.
 
timsk said:
I'm not attacking you dbp, I'm merely trying to understand. So, if you've never said that trend lines, demand/supply lines are rigid and precise, is it reasonable to conclude that they - like S/R lines - are soft? A simple question, nothing to get all defensive about.
Kind regards,
Tim.

I'm not being defensive. You said that I said that TL, etc, were rigid and precise. I don't recall having ever said so. As to their being "soft", for the same reason, whatever support and resistance seem to be found with indicators or trendlines are most likely coincidental since these other lines don't represent previous trading activity. In fact, they're constantly moving (see post above re S/R).
 
Last edited:
:|

Being open to the flow of market information is characteristic of objectivity and yields better results than deciding in advance what it is that one wants the information to be or to say, what Douglas calls "being available".

I fortunately posted the first three charts last night before the "gap" down occurred. This enabled me to view those three charts with a different eye than I would have this morning.

Today could be interesting or as dull as dishwater. But it shouldn't take long to find out. It's possible that NQ may continue its trip down to 1492. It's possible that ES may drop to potential S at 1250. It's possible that YM may overshoot 11000, though it may also hold there. Entertaining all these considerations is not "wishy-washy" but rather a matter of waiting for the market's "tells". Since not all of these have occurred, one must (a) be alert to them and (b) know exactly what he intends to do when they do occur.

Db

Note: For those who'd like to cut to the chase, at least with regard to the first post, above, rather than scroll through the next 80 posts, click this:

http://www.trade2win.com/boards/showthread.php?p=270411#post270411
 

Attachments

  • UPDN.jpg
    UPDN.jpg
    101.9 KB · Views: 625
  • COMP.jpg
    COMP.jpg
    61.9 KB · Views: 590
  • SR1.jpg
    SR1.jpg
    102.4 KB · Views: 726
  • SR2.jpg
    SR2.jpg
    31.1 KB · Views: 681
  • SR2.jpg
    SR2.jpg
    33.3 KB · Views: 643
  • SR2.jpg
    SR2.jpg
    33.7 KB · Views: 533
  • SR2.jpg
    SR2.jpg
    35.5 KB · Views: 540
  • SR2.jpg
    SR2.jpg
    46.4 KB · Views: 506
  • SR2.jpg
    SR2.jpg
    47.4 KB · Views: 525
  • SR2.jpg
    SR2.jpg
    48.4 KB · Views: 520
  • SR2.jpg
    SR2.jpg
    23.6 KB · Views: 587
  • SR2.jpg
    SR2.jpg
    49.7 KB · Views: 541
  • SR2.jpg
    SR2.jpg
    40.7 KB · Views: 520
Last edited:
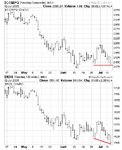
Two sectors may have found potential support for now.

erie
 

Attachments

  • XLI.gif
    XLI.gif
    60.7 KB · Views: 569
  • XLB.gif
    XLB.gif
    57.7 KB · Views: 520
erierambler said:
Two sectors may have found potential support for now.

erie

Yes, and the fact that we're in this particular place in the charts can mean a lot of profit opportunities, or at least it did this past week.

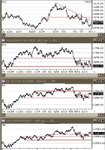
I know you start with context. Did you begin the week with a contextual chart similar to the first one I posted in post #1 (the stack of four futures charts)? Or did you adopt a different view?
 
dbphoenix said:
I know you start with context. Did you begin the week with a contextual chart similar to the first one I posted in post #1 (the stack of four futures charts)? Or did you adopt a different view?

Basically the same, one needs to look and see where price has been and has turned. Firstly from a distance of course.

erie
 
erierambler said:
Basically the same, one needs to look and see where price has been and has turned. Firstly from a distance of course.

erie

What are you currently trading?
 
dbphoenix said:
What are you currently trading?

The ES. I know you like the NQ, but I'm not able to watch the market much , so I need a full time broker. It is better for me with the ES, for now.

erie
 
Db, I also still watch the Avdvd. I see you don't have it posted in your charts here. It is valuable still as an indicator.

erie
 
erierambler said:
The ES. I know you like the NQ, but I'm not able to watch the market much , so I need a full time broker. It is better for me with the ES, for now.

erie

I've never thought one had to watch the market more with the NQ than with the ES, but maybe it's true.

In any case, assuming you traded the market last Monday (and let's pretend you did), what did you look at before the open?

(I do still use the AVDVd. As an "indicator", it's practically foolproof. But I more often look at the DV when nearing S and the AV when nearing R, along with the NHs and NLs. The DV and the NL charts are shown for a couple of the days last week in histogram form. The AV chart is also provided for one of those days.)
 
dbphoenix said:
In any case, assuming you traded the market last Monday (and let's pretend you did), what did you look at before the open?

I always look at where price traded the most the previous day and where are we. In that case price had traded mostly in the 1279- 1282 range(use volume at price). Previous day's high 1289.Previous day's low 1271.Last reaction high 1280.Last reaction low 1271.Avg daily range 12pts. 5 day average adv-decl volume rolling over. Have charts printed out and saved :)

erie
 
erierambler said:
I always look at where price traded the most the previous day and where are we. In that case price had traded mostly in the 1279- 1282 range(use volume at price). Previous day's high 1289.Previous day's low 1271.Last reaction high 1280.Last reaction low 1271.Avg daily range 12pts. 5 day average adv-decl volume rolling over. Have charts printed out and saved :)

erie

Would it be a lot of trouble to post them? That is, what you had prior to the open?
 
dbphoenix said:
Would it be a lot of trouble to post them? That is, what you had prior to the open?

No not at all. The adv-decl diff I keep in a spreadsheet, along with price and adv/decl issue statistics. (I also have a note that price diverged from the $XMI that day.)

erie
 

Attachments

  • ESJul7.gif
    ESJul7.gif
    15.3 KB · Views: 549
  • adv-decl diff.gif
    adv-decl diff.gif
    4.4 KB · Views: 449
Top