rainman2's journal

rainman2

Active member
Messages
139
Likes
13
I’m starting this journal for the purpose of becoming a better trader. After reading thread upon thread about everything, I’ve come to realize the importance of having a trading plan. For awhile I’ve told myself, “what good is having a setup when the dow is up, nasdaq is down and the s&p is flat or if their all up or all down? How can you use the same setup in a trending market and a range bound market?” I thought that you have to be discretionary trader so that you can adapt to an ever changing market. I no longer think that way.


I look forward to any and all comments about trades that will be posted and in “getting on” with my trading plan.
 
Although, this journal will be about intraday trading IWM, I entered into a longer term trade based on a price/volume setup (to the best of my understanding) as discussed by dbphoenix in his p/v thread, wasp's and I think fxcowboy's journal.
Here's my take:

1) possible selling climax that leaves long lower wick. Will that lower wick hold as support?

2) price breaks through support on lower volume which to me indicates that price will go lower. ( no buyers coming in)

3) price makes a new low on less volume than #1(less sellers) Will that lower wick hold as support?

4) Buyer pressure overcomes sellers as price rises. If you blend those 2 candles together you get huge volume with increasing price. (potential trend reversal)

5) price starts to rise on low volume (no sellers?)

6) last of the sellers ( I hope) Increased volume but no even close to where volume was at #1 and # 3, also at a higher low.

I entered at .63
 

Attachments

  • 2006-11-03_075057-pgwctrade.jpg
    2006-11-03_075057-pgwctrade.jpg
    140.6 KB · Views: 347
rainman2 said:
Although, this journal will be about intraday trading IWM, I entered into a longer term trade based on a price/volume setup (to the best of my understanding) as discussed by dbphoenix in his p/v thread, wasp's and I think fxcowboy's journal.
Here's my take:

1) possible selling climax that leaves long lower wick. Will that lower wick hold as support?

2) price breaks through support on lower volume which to me indicates that price will go lower. ( no buyers coming in)

3) price makes a new low on less volume than #1(less sellers) Will that lower wick hold as support?

4) Buyer pressure overcomes sellers as price rises. If you blend those 2 candles together you get huge volume with increasing price. (potential trend reversal)

5) price starts to rise on low volume (no sellers?)

6) last of the sellers ( I hope) Increased volume but no even close to where volume was at #1 and # 3, also at a higher low.

I entered at .63
Rainman2

First of all I would like to wish you well with your journal and your trading.

Although you are trying to produce some P/V analysis and thinking through what buyers and sellers are doing, I think you are applying it to the wrong stock. This stock has a very low price and thin volume. Your comment 4, for example, does not really stack up with price action showing a convincing reversal.

The problem is the history of this stock. Whilst I wouldn't normally take any notice of analysts and commentaries you might find this article interesting

http://www.forbes.com/2006/10/02/pegasus-attacks-shorts-biz-cx_lm_1003pegasus.html?partner=yahootix

or this fact:

Pegasus Wireless Corporation (OTCBB:PGWC - News), a leading provider of advanced wireless solutions, today began trading its securities on the OTC Bulletin Board Exchange. The Company recently voluntarily removed its securities from the Nasdaq Global Market and due to filing requirements, spent one week trading as a Pink Sheet stock. The Company is now exploring opportunities with other stock exchanges on which to list its securities.

You might also like to look at insider transactions to see how these are affecting a thinly traded stock e.g. on aug 25th about 307,000 shares at $5.78 were acquisitions on the non-open market and purchases by directors and officers which I suggest was an attempt to put the breaks on the earlier fall. It flattened out the curve a little before the big descent down to the present level.

Personally I would be looking to initially filter stocks for larger capitalisation and trading volumes, but that is only my personal opinion and should not be regarded as any recommendation to buy or sell any particular stock.

Charlton
 
Charlton said:
Rainman2

First of all I would like to wish you well with your journal and your trading.

Although you are trying to produce some P/V analysis and thinking through what buyers and sellers are doing, I think you are applying it to the wrong stock. This stock has a very low price and thin volume. Your comment 4, for example, does not really stack up with price action showing a convincing reversal.

The problem is the history of this stock. Whilst I wouldn't normally take any notice of analysts and commentaries you might find this article interesting

http://www.forbes.com/2006/10/02/pegasus-attacks-shorts-biz-cx_lm_1003pegasus.html?partner=yahootix

or this fact:

Pegasus Wireless Corporation (OTCBB:PGWC - News), a leading provider of advanced wireless solutions, today began trading its securities on the OTC Bulletin Board Exchange. The Company recently voluntarily removed its securities from the Nasdaq Global Market and due to filing requirements, spent one week trading as a Pink Sheet stock. The Company is now exploring opportunities with other stock exchanges on which to list its securities.

You might also like to look at insider transactions to see how these are affecting a thinly traded stock e.g. on aug 25th about 307,000 shares at $5.78 were acquisitions on the non-open market and purchases by directors and officers which I suggest was an attempt to put the breaks on the earlier fall. It flattened out the curve a little before the big descent down to the present level.

Personally I would be looking to initially filter stocks for larger capitalisation and trading volumes, but that is only my personal opinion and should not be regarded as any recommendation to buy or sell any particular stock.

Charlton
Charlton,

Thanks for your well wishes. As for the trade, I agree with you that it is very speculative and not a stock that I would put a great amount of capital in. At the same time, it does have imo an intriguing p/v relationship and a base going on 2 months. The low price of the stock is one of the reasons I took the trade as, more than anything, this trade is a learning experience. That being said, with Microsoft coming out with its ZUNE media player to compete with the IPOD, wireless streaming video exchange is an exciting technolgy.
 
If you're interested in my take on this, I'll be happy to provide it if and when you open up a journal and transfer all of this there. Having all of your stuff in one place will aid your learning curve.

Db

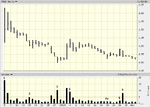
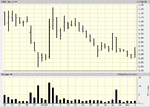
Following up on the above, I've posted the charts below.

1. You're correct about the SC. However, an SC rarely translates into a bottom. The actual bottom may not occur until days or weeks later. Therefore, there's no reason to expect the bottom of the bar to provide S (rather than go again into what provides S/R, I'll refer you to my S/R thread). The fact that price rises well off the low suggests that selling is at least slowing down coincidentally with an increase in buying pressure (hence the degree of trading activity), but this may be likened to pumping the brakes when trying to come to a stop. The stock after all fell 200pts.

2. At this point, zoom in on the area of interest so that you can see what you're doing. There is movement here which is difficult to detect when the action is so squashed.

You are correct that a falling price on lower volume suggests weak buying pressure. But what price is going to do is not your concern. Focus on the moment.

Price makes a NL @2 and the bar after, but all the bars thereafter are inside bars. Therefore, there's no SP to provide S. There may be some S provided by the sideways movement, and the trader may want to bracket the trade, but experience would likely tell him that a long is far too early and a short far too late. Since there has as yet been no test, there's no downside to waiting for it.

3. Price makes a NL @3 on increased TrAc and closes well off the low, suggesting that buying pressure is finally entering the match. But, again, this is not necessarily S, for the same reasons provided in (1).

4. (3) now becomes an SP and potential S, though in and of itself, the S is weak. But there's no trend reversal or even a potential for one. A trend reversal will be a long time coming. When it does come, you may be too old to care.

5. There are of course sellers. Otherwise, there would be no TrAc at all. However, they do seem to be done. Why wouldn't they be? It's the people at home trading in their pajamas who are now interested in the stock.

However, if 4a were a test, the TrAc would be higher. There's no interest here, so there's little or no significance to this "low". The fact that the "lift" provided at 5 doesn't go anywhere supports this hypothesis.

6. The "rally" at 5 is aborted. There are still plenty of sellers out there, but far fewer than before, but there don't have to be as many as before since volume has been crap for so long. Many of those who bought after the SC are likely bored and want to put their money to better use elsewhere. They're done. They're out. There is still no definitive low, and the accumulation process has barely begun (given the price, it may not have begun at all and may never begin).

Looking solely at the evidence rather than at what you want or hope for, there's no hurry to do anything about this stock. If you want to stay in it, stay in it, but the evidence will not provide you with any reasons to do so, at least not yet. And in the meantime, there are opportunity costs to consider.

Db
 

Attachments

  • pgwc.gif
    pgwc.gif
    22.4 KB · Views: 345
  • pgwc2.gif
    pgwc2.gif
    22.4 KB · Views: 355
Last edited:
dbphoenix said:
Looking solely at the evidence rather than at what you want or hope for, there's no hurry to do anything about this stock. If you want to stay in it, stay in it, but the evidence will not provide you with any reasons to do so, at least not yet. And in the meantime, there are opportunity costs to consider.
Db
Thanks for your take db. What I thought was a high probability trade turns out to be a speculative guess. I'm going to hold for the time being if for no other reason but to see what happens.

What's funny about this trade is that I took it against what my trading stategy is going to be.I hope that's not a bad omen for this journal. Speaking of which, my trade strategy will be a breakout stategy based on the Darvas box. I will be looking to buy a break of resistance and looking to sell a break of support. I will get more into the details after I come back from vacation(leaving tuesday for a week).
 
Last edited:
Hidden s/r

Here's a trade that I got stopped out in on Friday. My s/r "box" was drawn on the 15 minute chart and I trade off the 5 minute.

Price broke through resistance on the 9:35 candle at 74.90 which gave a long signal.That candle had a high of 75.24. My initial entry would 75.25 which was never hit.The 9:40 candle had a high of 75.17 so my new entry price became 75.18 which was never hit. The 9:45 had a high of 75.11 so my entry became 75.12 of which i entered on the 9:50 candle.My target was resistance at 75.40 with half profit at .20c(75.32) . My stop was placed 75.01 which was a break of the 9:45 candle low. I was stopped out on my entry candle of 9:50.

Obviously this was a failed breakout, but why? Possible reasons:

1) .42 cents move in 5 minutes ( capitulation )
2) climatic volume?
3) hidden s/r zone as seen in the 15 min chart

These are but a few of the questions I need to be aware of in real time to access the probabilities of the trade.Hopefully this journal will help in that respect.
 

Attachments

  • 2006-11-03_215243-iwm15hidsr.jpg
    2006-11-03_215243-iwm15hidsr.jpg
    158.5 KB · Views: 355
  • 2006-11-03_214927-iwm5failbo.jpg
    2006-11-03_214927-iwm5failbo.jpg
    193.1 KB · Views: 314
rainman2 said:
What's funny about this trade is that I took it against what my trading stategy is going to be.I hope that's not a bad omen for this journal. Speaking of which, my trade strategy will be a breakout stategy based on the Darvas box. I will be looking to buy a break of resistance and looking to sell a break of support.

There's more to this particular strategy than buying/shorting BOs. This strategy -- and perhaps all BO strategies -- require momentum in order to work, same as with RET strategies, including the "cup with handle". If upward momentum has not preceded your box, whatever "BO" might occur will not likely be successful as BOs require substantial interest in order to pan out. I see no evidence of that here.

Db
 
rainman2 said:
Here's a trade that I got stopped out in on Friday. My s/r "box" was drawn on the 15 minute chart and I trade off the 5 minute.

Price broke through resistance on the 9:35 candle at 74.90 which gave a long signal.That candle had a high of 75.24. My initial entry would 75.25 which was never hit.The 9:40 candle had a high of 75.17 so my new entry price became 75.18 which was never hit. The 9:45 had a high of 75.11 so my entry became 75.12 of which i entered on the 9:50 candle.My target was resistance at 75.40 with half profit at .20c(75.32) . My stop was placed 75.01 which was a break of the 9:45 candle low. I was stopped out on my entry candle of 9:50.

Obviously this was a failed breakout, but why? Possible reasons:

1) .42 cents move in 5 minutes ( capitulation )
2) climatic volume?
3) hidden s/r zone as seen in the 15 min chart

These are but a few of the questions I need to be aware of in real time to access the probabilities of the trade.Hopefully this journal will help in that respect.

My post just above was made before you posted these charts, though just barely. So what I said above applies to these charts as well.

First, you know where potential R is before the open, though I would place it at 74.8. Therefore, your buy order should be placed just above 74.8 at the outset. If you miss it for some reason, then you miss it. Chasing the price is a bad start and cannot become a habit.

Second, your "hidden" S/R is not hidden at all. Look back at October 23rd. The context of your trade is at least three weeks long. The fact that price made a LrL is not encouraging for a buy.

Third, immaterial but FYI, it's "climactic", not "climatic", though you definitely got rained on.
 
dbphoenix said:
There's more to this particular strategy than buying/shorting BOs. This strategy -- and perhaps all BO strategies -- require momentum in order to work, same as with RET strategies, including the "cup with handle". If upward momentum has not preceded your box, whatever "BO" might occur will not likely be successful as BOs require substantial interest in order to pan out. I see no evidence of that here.

Db
Would momentum be defined by a higher low? Because that happened premarket or should the higher low occur after the breakout which could have been intepreted to have happened on a break of the 10 o'clock candle. Or does "interest" mean buying pressure which was evidenced on the breakout candle?
 
dbphoenix said:
My post just above was made before you posted these charts, though just barely. So what I said above applies to these charts as well.

First, you know where potential R is before the open, though I would place it at 74.8. Therefore, your buy order should be placed just above 74.8 at the outset. If you miss it for some reason, then you miss it. Chasing the price is a bad start and cannot become a habit.

Second, your "hidden" S/R is not hidden at all. Look back at October 23rd. The context of your trade is at least three weeks long. The fact that price made a LrL is not encouraging for a buy.

Third, immaterial but FYI, it's "climactic", not "climatic", though you definitely got rained on.
Granted on the daily chart, the "support box" that was formed on 10/23 was broken on 11/1 but should that mean that I should only be looking for shorts intraday? As for buying the first break of R (74.80 is a r box on the 5min), my minimal backtesting says "whipsaw city". That's why rule #1 states : Do not enter a trade until the first 5 min candle has formed.

In New Jersey, believe me when I tell you "it's climatic" For further clarification just watch any episode of the "soprano's". Others think that's acting, we just think it's everyday life.
 
dbphoenix said:
There's more to this particular strategy than buying/shorting BOs. This strategy -- and perhaps all BO strategies -- require momentum in order to work, same as with RET strategies, including the "cup with handle". If upward momentum has not preceded your box, whatever "BO" might occur will not likely be successful as BOs require substantial interest in order to pan out. I see no evidence of that here.

Db

Excellent post.........

Would momentum be defined by a higher low? Because that happened premarket or should the higher low occur after the breakout which could have been intepreted to have happened on a break of the 10 o'clock candle. Or does "interest" mean buying pressure which was evidenced on the breakout candle?

Rainman, try a 60 min chart with a simple MA of 30 or 35 to gauge momentum. Then look for break of s/r or Darvas box. Then again there are always exceptions to the rules........:)

erie
 
erierambler said:
Excellent post.........


Rainman, try a 60 min chart with a simple MA of 30 or 35 to gauge momentum. Then look for break of s/r or Darvas box. Then again there are always exceptions to the rules........:)

erie
erie,

thanks for the tip. After review, a breakout with price below the simple ma (i picked 33) would seem to have a lower probability of succeeding.
 
rainman2 said:
Would momentum be defined by a higher low? Because that happened premarket or should the higher low occur after the breakout which could have been intepreted to have happened on a break of the 10 o'clock candle. Or does "interest" mean buying pressure which was evidenced on the breakout candle?

Since you're structuring your own environment, you can define momentum however you like. Just make sure you define it in a way that turns a profit for you.

A HrL (the HrL here takes place in the middle of the afternoon) does suggest at least a temporary lull in the downmove. And a HrH above the LSH does define a trend reversal. However, that reversal must be placed in a context. This sort of pissant trend reversal does not mean anything particularly momentous, particularly given all the R ahead (see again the past three weeks). Therefore, it is even more important to focus on what's in front of you rather than waste time on profit targets. In this case, if you're going to play this, you have to be prepared to place your stop either below the "box" or just behind the entry, because if it fails, it's going to fail quickly, and there's no point in hanging around. You happened to place a tight stop, which turned out to be the right thing to do. But if you did it out of fear, you need to think more clearly about what you're doing and why.
 
rainman2 said:
Granted on the daily chart, the "support box" that was formed on 10/23 was broken on 11/1 but should that mean that I should only be looking for shorts intraday? As for buying the first break of R (74.80 is a r box on the 5min), my minimal backtesting says "whipsaw city". That's why rule #1 states : Do not enter a trade until the first 5 min candle has formed.

You don't necessarily have to look only for shorts; but don't expect anything from longs. Focus on the moment, not on a profit target.

As for buying the break thru R, developing hypothetical rules is part of the process. Go with it. Keep records. If it turns out to be a counter-productive rule, the market will let you know.
 
What I see.
 

Attachments

  • 2006-11-04_172754iwm5min.jpg
    2006-11-04_172754iwm5min.jpg
    204.3 KB · Views: 260
  • 2006-11-04_172225-iwm15min.jpg
    2006-11-04_172225-iwm15min.jpg
    164.8 KB · Views: 227
  • 2006-11-04_171100-iwm60min.jpg
    2006-11-04_171100-iwm60min.jpg
    164.3 KB · Views: 215
  • 2006-11-04_165551-iwmdaily.jpg
    2006-11-04_165551-iwmdaily.jpg
    217.8 KB · Views: 224
  • 2006-11-04_170131-iwmmonthly.jpg
    2006-11-04_170131-iwmmonthly.jpg
    89.9 KB · Views: 228
dbphoenix said:
Since you're structuring your own environment, you can define momentum however you like. Just make sure you define it in a way that turns a profit for you.

A HrL (the HrL here takes place in the middle of the afternoon) does suggest at least a temporary lull in the downmove. And a HrH above the LSH does define a trend reversal.
For clarity, is this how you define momentum? Or not until a HrL above the low of 10/23 happens would a momentum shift occur?
 
Last edited:
Top