Profitable way to trade UK Shares??

Chorlton

Established member
Messages
693
Likes
48
Hello All & firstly, a belated Happy New Year to everyone at T2W.

The reason for my post is that I would be interested from investors / traders what methods are being used to swing / position trade UK shares in a profitable way.

Obviously, the specifics of any trading plan are probably private but I would be interested what general methods are being used.

By menthods I mean whether fundamentals or TA are used and to what degree each type of analysis is used?

ie. Do investors/ traders (i) only use TA to generate Buy & Sell signals, (ii) only have a specific % of a trading plan dedicated to TA while the rest is company fundamentals, (iii) purely use Company Fundamentals with just a small % of TA to general entry & exit point (such as the CANSLIM method) or (iv) something else entirely.

I ask because I have been trying to construct a trading plan which relies almost 85-100% on TA. However, as you can probably guess from this post, my success has been less than favourable & after having some consistant losses, I am now not sure whether this is a good strategy!!! :(

Any advice would be gratefully received ....

Regards,

Chorlton
 
Hi Chorlton and A Happy New Year to you, too,

I use charts mostly for my trading and have my ups and downs like everyone else. May I ask what you are using? In the main, I trade similarly to Barjon, you'll find him around here. In fact, he has just posted on the
"Swing and Position Trading" board and has included a chart, too, but you will find charts of his on other boards.

I'm not keen on indicators- the signals are too late, although they look great when using hindsight. I can't fathom volume, although some swear by it. Crossovers on averages are too late, too. Take a look at Jon's charts and you will see that he uses previous highs and lows.

Split
 
Hi Split,

Thanks for the reply.

Can I ask what instruments you trade? You mention that you trade similarly to Barjon so do you rely on previous highs and lows to dictate when to enter and exit trades??

I'm using predominately TA (charts) as a means to trade but agree totally with you that all indicators have lag. Not only that but surely only those indicators traded (& relied upon) by a vast majority of other investors/traders are reliable (well, when I say reliable I actually mean more reliable than those not widely used by others!!).

It would probably be a very useful exercise to have a poll on T2W to see which indicators are used by whom to trade the various instruments. Surely then by using the same indicators as those which are used the most to trade your specific instrument, would probably give you a more consistant buy/sell signal. Only my opinion though....

I also looked purely at price & volume to trade (as per Tom Williams VSA method) but again this is highly open to interpretation IMO. In hindsight (as per TA where you can see well defined chart patterns AFTER the event!!!) it is easy to see where a price reverses directly after a days trading on high volume but with a low spread for example. However I have seen numerous similar price/volume/spread set-ups where in reality the price has actually continued in its current trend with no reversal.

The idea of trading higher highs and higher lows (trend following) seems like a sensible method as its happening in real-time ie. no lag, and from my miminal experience trading with the trend seems like a more reliable method.

With regard to previous highs & lows, can I ask what indicates a buy and sell signal for you?


Chorlton
 
barjon said:
hi, chorlton

'scuse me for sticking my nose in.

i'm not a geat fan of indicators myself. so far as my type of entries are concerned it's summed up here http://www.trade2win.com/knowledge/articles/general_articles/simple-swing-trading/

good trading

jon


Hi Jon,

Many Thanks for the link to the article. Its kind of given me "food for thought". I do have a couple of questions though if you don't mind answering.

1) You strategy seems to be based on only Price movements. Do you use any other pieces of information such as Volume to confirm what the chart is showing you?? If you are using only price to trade then surely you are restricting yourself & therefore not seeing the "whole" picture??

Please don't think I am criticising your methods but I am very interested in how experienced traders trade.

2) How do you select the stocks in the first place which offer the potential for Trading swings? Do you choose stocks with good underlying fundamentals or do you simply select those with have the desired chart set-ups?

Hope you don't mind the questions but as I said I'm very interested in finding out more.....

Kind Regards,

Chorlton
 
chorlton,

No problem - ask away :D

1. If I could understand the volume/price dynamic I'd try to use it, but then I'd get into interpretation mode where I'd be competing with the real experts who would take me to the cleaners most of the time :devilish: .

I've tested many variables - such as swing low bar as hammer type candle with high volume; direction of 20 day moving average; rsi level; etc; etc; etc - and at the mechanical level none made a significant difference other than the direction of the market - the risk is much, much higher when trading against market direction.

I accept that I'm not seeing the "whole picture" but I also accept that I do not have the skill to use subsidiary information to draw that picture with any better accuracy.

2. I just stick to ftse100 constituents (not all of them) and just scan daily for opportunities.

Hope this helps - good trading

jon
 
barjon said:
chorlton,

No problem - ask away :D

1. If I could understand the volume/price dynamic I'd try to use it, but then I'd get into interpretation mode where I'd be competing with the real experts who would take me to the cleaners most of the time :devilish: .

I've tested many variables - such as swing low bar as hammer type candle with high volume; direction of 20 day moving average; rsi level; etc; etc; etc - and at the mechanical level none made a significant difference other than the direction of the market - the risk is much, much higher when trading against market direction.

I accept that I'm not seeing the "whole picture" but I also accept that I do not have the skill to use subsidiary information to draw that picture with any better accuracy.

2. I just stick to ftse100 constituents (not all of them) and just scan daily for opportunities.

Hope this helps - good trading

jon


Jon,

"....No problem - ask away :D..... " .... You shouldn't have said that Jon, as I definately will now !!! :cheesy:

So if I understand you correctly you are trading FTSE 100 stocks using only Price and obviously waiting to for the correct chart-setups before entering trades. Do you also use a long-term MA such as 200MA to assess trend / market direction or do you just keep an eye of the FTSE100 Index for confirmation??

Out of the FTSE 100 stocks, is there any preference as to which ones you trade or is it purely based on those offering the correct chart set-ups? The reason I ask is that I am currently reading a book about CANSLIM where initially stocks are chosen with good fundamentals and then you trade them when they are about to rally.

Thanks,

Chorlton
 
chorlton

Chorlton said:
Jon

So if I understand you correctly you are trading FTSE 100 stocks using only Price and obviously waiting to for the correct chart-setups before entering trades. Do you also use a long-term MA such as 200MA to assess trend / market direction or do you just keep an eye of the FTSE100 Index for confirmation??

Yes and use relation to previous swing high/low + sma 20 for ftse trend

Out of the FTSE 100 stocks, is there any preference as to which ones you trade or is it purely based on those offering the correct chart set-ups? The reason I ask is that I am currently reading a book about CANSLIM where initially stocks are chosen with good fundamentals and then you trade them when they are about to rally.

Depends on time scales - not bothered about fundamentals for shorter term moves, so mainly chart set-ups (and the history of how individual shares tend to move).
Thanks,

Chorlton

good trading

jon
 
Jon,

Thanks for the info............. and Good Trading to you as well.........

Chorlton
 
Chorlton said:
Hi Split,

Thanks for the reply.

Can I ask what instruments you trade? You mention that you trade similarly to Barjon so do you rely on previous highs and lows to dictate when to enter and exit trades??

I have traded indices but have stopped that and have been swing and position trading FTSE100 shares exclusively in recent years. These are widely traded with good volumes and I use TA with these. I use previous highs and lows a lot more than breakouts but I also use pullbacks in established trends. An average is the only indicator that I find useful for this purpose.I do not see many bargains with the smaller cap shares for trading purposes and am more inclined to buy them for my portfolio than those of the FTSE100 because I study the fundamentals, as far as my limited knowledge allows. American stocks are very popular but I don't like the afternoon and evening hours.

I'm using predominately TA (charts) as a means to trade but agree totally with you that all indicators have lag. Not only that but surely only those indicators traded (& relied upon) by a vast majority of other investors/traders are reliable (well, when I say reliable I actually mean more reliable than those not widely used by others!!).

It would probably be a very useful exercise to have a poll on T2W to see which indicators are used by whom to trade the various instruments. Surely then by using the same indicators as those which are used the most to trade your specific instrument, would probably give you a more consistant buy/sell signal. Only my opinion though....

I believe that indicators are used to help a trader come to a decision that he is unable to make by using a simple candle or bar chart. They tell the trader nothing but make him come to a decision which, when he makes it, is too late. I'm afraid I am completely against indicators.....sorry! I feel the same about breakouts. By the time it happens I rarely feel happy about my stop, because it is too far away.

The idea of trading higher highs and higher lows (trend following) seems like a sensible method as its happening in real-time ie. no lag, and from my miminal experience trading with the trend seems like a more reliable method.pure price action.

That's where I look for pullbacks in an established trend. I doubt whether any indicator will help spot that, it is price action

With regard to previous highs & lows, can I ask what indicates a buy and sell signal for you?

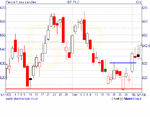
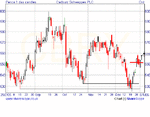
I opened BP at 613.6 on Dec 28th using a previous low as an entry signal. I should have opened CBRY then, too, as you can see, but I was doing other things. But the chart gives an idea of the pullback that I mentioned, once I thought I had a trend. I opened that on Jan 3rd at 551.

Good Trading

Split
 

Attachments

  • BP.gif
    BP.gif
    12.5 KB · Views: 422
  • CBRY.gif
    CBRY.gif
    15.6 KB · Views: 407
Great Post Split...... Many Thanks.....

1 further question ;-) Can I ask what the horizontal red line at 551 on the 2nd chart represents???

Thanks and good trading to you too............

Chorlton
 
Hi Chorlton,

The black line on the CBRY chart shows where the previous low method would have produced a profit but I wasn't paying attention to that share at the time. When I thought that the trend on the new leg was established I waited for a pullback and entered as close as I could. That is the red line.
Today , it is 559. Once a share is reasonably in profit I put a stop just above breakeven and try to find others. Yesterday I entered SPW.

I get my fingers scorched at times, the same as everyone else, but the thing is to try to keep to a constant plan so that a statistical %age of gains over losses is favourable.

Keep the rules as simple as possible. Good trading.

Split
 
Splitlink said:
Hi Chorlton,

The black line on the CBRY chart shows where the previous low method would have produced a profit but I wasn't paying attention to that share at the time. When I thought that the trend on the new leg was established I waited for a pullback and entered as close as I could. That is the red line.
Today , it is 559. Once a share is reasonably in profit I put a stop just above breakeven and try to find others. Yesterday I entered SPW.

I get my fingers scorched at times, the same as everyone else, but the thing is to try to keep to a constant plan so that a statistical %age of gains over losses is favourable.

Keep the rules as simple as possible. Good trading.

Split


Hi Split,

Just re-read your posts again on this thread and have realised just how informative & useful they are :cheesy: I seem to be slowly adopting a similar strategy to yourself after trying many different tactics over the last year.

You mention that the only indicator you use (apart from Price) is a moving average, as all of them suffer badly from lag. As a result, have you heard of the Hull Moving Average which seems to not really suffer from lag BUT at the same time still remaining smooth?

I'm sure you've probably already come across it but if not try this link:

http://www.justdata.com.au/Journals/AlanHull/hull_ma.htm


I also noticed that you posted some stocks for me on another thread which you are currently long with Finspreads. Consequently, would you be interested in sharing stocks with possible good chart set-ups, mainly from an educational point of view?

Regards,

Chorlton
 
Chorlton said:
Hi Split,

Just re-read your posts again on this thread and have realised just how informative & useful they are :cheesy: I seem to be slowly adopting a similar strategy to yourself after trying many different tactics over the last year.

You mention that the only indicator you use (apart from Price) is a moving average, as all of them suffer badly from lag. As a result, have you heard of the Hull Moving Average which seems to not really suffer from lag BUT at the same time still remaining smooth?

I'm sure you've probably already come across it but if not try this link:

http://www.justdata.com.au/Journals/AlanHull/hull_ma.htm


I also noticed that you posted some stocks for me on another thread which you are currently long with Finspreads. Consequently, would you be interested in sharing stocks with possible good chart set-ups, mainly from an educational point of view?

Regards,

Chorlton

The difficulty I find of working with custom made averages and indicators is that they take up too much time. At EOD I come home from work and, before bed, scan through FTSE100 on Sharescope, make a short list of chart patterns that I see could be forming and use bar charts or candles on those, the next morning. I have most of the morning free for trading, if I want to and, if any of those short listed stocks makes a pullback, I trade it for a hold of as long as possible. Intraday does not interest me because SB spreads are unfavourable although I am not averse to closing for a good profit or to cut a loss the same day if necessary.

Split
 
Splitlink said:
Chorlton said:
Hi Split,

Thanks for the reply.

Can I ask what instruments you trade? You mention that you trade similarly to Barjon so do you rely on previous highs and lows to dictate when to enter and exit trades??

I have traded indices but have stopped that and have been swing and position trading FTSE100 shares exclusively in recent years. These are widely traded with good volumes and I use TA with these. I use previous highs and lows a lot more than breakouts but I also use pullbacks in established trends. An average is the only indicator that I find useful for this purpose.I do not see many bargains with the smaller cap shares for trading purposes and am more inclined to buy them for my portfolio than those of the FTSE100 because I study the fundamentals, as far as my limited knowledge allows. American stocks are very popular but I don't like the afternoon and evening hours.

I'm using predominately TA (charts) as a means to trade but agree totally with you that all indicators have lag. Not only that but surely only those indicators traded (& relied upon) by a vast majority of other investors/traders are reliable (well, when I say reliable I actually mean more reliable than those not widely used by others!!).

It would probably be a very useful exercise to have a poll on T2W to see which indicators are used by whom to trade the various instruments. Surely then by using the same indicators as those which are used the most to trade your specific instrument, would probably give you a more consistant buy/sell signal. Only my opinion though....

I believe that indicators are used to help a trader come to a decision that he is unable to make by using a simple candle or bar chart. They tell the trader nothing but make him come to a decision which, when he makes it, is too late. I'm afraid I am completely against indicators.....sorry! I feel the same about breakouts. By the time it happens I rarely feel happy about my stop, because it is too far away.

The idea of trading higher highs and higher lows (trend following) seems like a sensible method as its happening in real-time ie. no lag, and from my miminal experience trading with the trend seems like a more reliable method.pure price action.

That's where I look for pullbacks in an established trend. I doubt whether any indicator will help spot that, it is price action

With regard to previous highs & lows, can I ask what indicates a buy and sell signal for you?

I opened BP at 613.6 on Dec 28th using a previous low as an entry signal. I should have opened CBRY then, too, as you can see, but I was doing other things. But the chart gives an idea of the pullback that I mentioned, once I thought I had a trend. I opened that on Jan 3rd at 551.

Good Trading

Split


Hey Split,

Hope you're well :cheesy:

A few months ago we were discussing indicators with regard to trading UK stocks. I know you mentioned that you're not a keen follower of them due to their lag, which I also agree with.

However, have you ever used the Accumulation / Distribution line??? What I like about it is that it relies solely on Price and the corresponding daily Volume.

I've been using it for a few weeks and it seems reasonably effective in predicting changes in a trend. Its also seems useful in determining whether to enter a trade following a recent pullback. ie. If the SP is falling but the A/C is still rising this seems to indicate that the trend will continue.

I won't go into anymore detail as I'm sure you've come across it before but as you also like to trade trends I thought I'd share my experiences of it with you.

Regards & Happy Trading

Chorlton
 
Chorlton,

maybe you could post a chart of a recent trade using the indicators you mentioned....
 
Top