Price updates as proxy for trade volume

DAXJockey

Junior member
Messages
17
Likes
1
Been a lot of debate on here in years gone by as to whether price updates in FX are a good proxy for actual traded volume, since there is no volume data available from one central exchange a la futures etc. A few prominent T2W'ers came out to openly say that tick volume was complete rubbish, and something that should be ignored.

http://mediaserver.fxstreet.com/Rep...4b6c/a72ee301-3076-48e6-b7ae-a13cb735fe3b.pdf

The research displayed in this article (taken from the current issue of FX Trader Magazine) would seem to suggest otherwise... anyone have any thoughts on the matter? Would be great if it were true as it would open up the possibility of using volume-based strategies and indicators within the FX markets.
 
no-one? Good to see things haven't changed round here! Should have named the thread 'how to make ****loads of money in FX with no original thought'...
 
no-one? Good to see things haven't changed round here! Should have named the thread 'how to make ****loads of money in FX with no original thought'...

interesting article

i'm pretty new to forex but it seems logical that the number of times a price changes per unit of time might be a reasonable proxy for volume

the hard part i see is measuring it (MACD histogram divergence can)
 
If you are trading forex and volume is an integral part of your strategy then you should trade the futures since they show actual trading volume.

In spot fx most brokers are now using 5 digit pricing. IMO, tick data is practically useless since you can have multiple price changes within a single full pip. What this is showing is open for debate and is easily manipulated....which makes it not very useful. If your broker is still using 4 digits then tick data as a substitute for volume is reasonable if you use it more as an eyeball test rather than an important part of your strategy.

Keep in mind having traded spot forex for several years but not futures, this is my opinion only, and is not backed up by any quantifying data. Other opinions may vary.

Peter
 
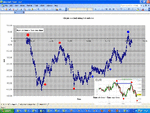
Daxjockey tick volume (price updates) has much value, but its not perfect..

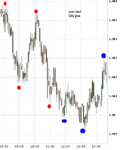
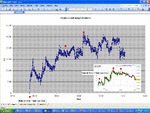
see attached charts, it shows tick volume for the eur/usd on the 6th
and 7th of june..

I tend to plot these graphs realtime for eur, gbp and usd for
a feel of the market. Not collected tick volume for aus, cad, nzd and jpy yet.
 

Attachments

  • eur_usd tick volume 6th jun.GIF
    eur_usd tick volume 6th jun.GIF
    94.8 KB · Views: 775
  • eur_usd chart 6th jun.GIF
    eur_usd chart 6th jun.GIF
    12.7 KB · Views: 937
  • eur_usd tick volume 7th jun.GIF
    eur_usd tick volume 7th jun.GIF
    91.8 KB · Views: 496
enragedcow you quoted: "the hard part i see is measuring it (MACD histogram divergence can)"

I assume your into chart patterns and look for the double top/bottom patterns and use macd to spot divergance
or reversals?

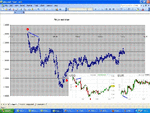
This is kind of possible for forex, not using a price indicator but looking at a basket of currencies instead..
see attached chart..
 

Attachments

  • usd_7th1_jun.GIF
    usd_7th1_jun.GIF
    93.9 KB · Views: 498
Last edited:
Interesting, how did you collect the data david, if you don't mind me asking? Are you using an ECN, or is this off something like ESignal
 
Daxjockey its GTIS forex data/esignal, plus advfn also provide this data.

I dont know if an average person can gain access to ECN data
like hotspot/EBS as mentioned in the article?
 
Daxjockey I forgot to mention that when I collect tick volume data, its for a basket of
currencies... So if I was looking at the Eur/Usd pair, I would collect tick volume for a basket
of eur currencies and on the opposite side a basket of usd pairs...

I suppose its a similar concept to those currency meters but using tick volume.
 
Top