Hi all,
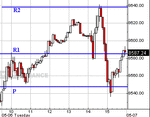
I noticed on the www.eurostoxx.co.uk webiste that Helen uses a pivot calculator. The data to be put in are the high/low and closes from the day before. I tried it out this morning based upon the FTSE cash market and remarkably the R2 figure was about 4000-00. Looking at the FTSE cash today it peaked at just over 4000-00. Is this some king of crystal ball or what? Does anyone actively use a pivot table and if so does anyone know how these figures are determined?
FTSEBOY
PS Please disregard my naivity as I am new to the game


