WklyOptions
Well-known member
- Messages
- 269
- Likes
- 24
Gd mng T2W members,
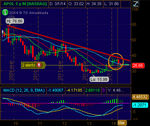
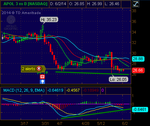
Here is my Jun 2014 - Swing Trade 1 - WYNN using a Reverse Diag Spread:
Trade Position:
Bought to Open (+1x) WYNN Jul(19th) $29 Calls ($4.15-$4.35)
Sold to Open (-1x) WYNN Sep(20th) $31 Calls ($5.55-$5.85)
Net Credit of (+$1.37) (x10) = (+$1370)
Initial Risk/Margin = (-$430) per spread (x10) = (-$4300)
Target = WYNN to attack Key Resistance at the $250 zone - but anywhere > $240 already should be profitable.
Duration = Recent pullback from 3/5/14 to low on 4/25/14 = about 7 wks. Long call purchased was the Jul(19th) expiry. I prefer to purchase the shortest expiry to minimize overspending on extrinsic time value.
Technical Analysis:
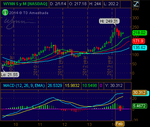
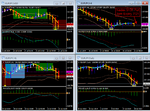
Filter: Monthly Chart = higher highs, higher lows = Bullish trend & momentum.
Indicators: MACD > 0 and also Fast Line (FL) is > Slow Line (SL)
Indicators: Price > Alligator MAs
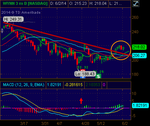
Entry: Daily Chart = Pullback for about 7 wks duration - then higher highs, higher lows.
Indicators: Price > trendline break to the upside
Indicators: Price > Alligator MAs
Hope details and images clear enough for T2W readers to study & follow along.
Any questions and/or constructive comments? Post or PM is fine...
Thx.
WklyOptions

