Making directional bets can be rather risky in a choppy market like this. Trading spreads may be a safer way to trade. Traders can execute inter-commodity spreads as well as calendar spreads.
Inter-commodity spreads include:
Oil/Gold, Gold/Silver, Oil/Natural Gas, Gold/ Dow Jones
Calendar spreads include:
Buy near month copper and sell far month copper, Buy Winter natural gas and sell Summer natural gas
a) The logic of buying near month copper and selling far month copper is when copper is in contango situation. As this commodity is in a tight situation, contango will eventually turn into backwardation situation. Hence this spread trade will be profitable.
If you do not understand the concept of backwardation and contango, read my article on "Must Know Concepts on Commodities Trading" in my website.
b) The logic of buying winter natural gas is that consumption of natural gas rises in winter season and reduces in summer season.
Inter-commodity spread trade for Oil/Gold
Today I am interested in the inter-commodity spread for Oil/Gold.
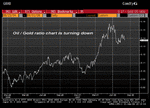
Oil / gold ratio chart looks toppish and has started to move downward (chart can be found in my website). I believe this downward movement is sustainable, so the strategy is to sell oil and buy gold.
I had sold 1 lot of supermini oil at 115.00 and bought 1 lot of gold at 822.63.
To execute this strategy you need to trade supermini oil contract, which US$1 represents US$100.


