Hi,
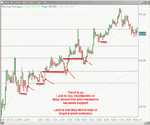
I made my first trade today, I have included a chart which pinpoints certain reasons for the trade. It is strictly technical analysis, I do not have knowledge of any fundamentals with respect to this currency pair. Anyways, thats probably a recipe for disaster in itself but here is my thinking on the trade:
I usually watch a 15min Chart and a 1min Chart.
Pictured is the 1min Chart.
The first thing I noted was there was some support at 17:50-18:00 - this can't really mean much considering the 1min chart and it's the only time it has reached this barrier but it was pushed up from this area and then remained fairly stagnant (sideways) from 18:20 to around 19:20 where the downtrend begins. I had already made a mental note to watch for a possible long position if it was to hit the previous level of support - by possible, I mean, I would check other indicators.
As I watched the chart move I could see it seemed to be in a real downtrend, as you can see from each selling interval the sells usually had the price even lower before being pushed back up a little - so seemingly, there was still plenty of sellers (imo, my analysis, w/e).
The pair hit very close to the previous mentioned "level of support" again, it's hard to call it that with this timeframe but the 15min also seemed to lend it credibility.
When it got close I started to keep an eye on MACD and RSI indicators, both looked to be favorable for a long position. MACD was crossing in an uptrend and RSI was hovering in the lower 20s.
I then bought at: 89.853. I put a TP @ 90.005 and a SL @ 89.700 (150 pips either way).
Reasons for my TP at 90: It had closed at or above 90+ a few times before around the 18:10 - 18:20 mark and the 19:00 to 19:20 mark before being pushed down. Looking at it now, I should of had my TP lower. Maybe 89.950
My SL was terrible, way too low. It should of been something more like 89.780. I think this would of given me enough leeway to manager a further decline and stil get into the forthcoming uptrend while managing to not lose so much if I was completely wrong.
So, yea, that was my thinking. I'm sure most of it is wrong and misappliedbut I'm looking for people to let me know what I've done wrong and what I can do to fix it. (ie: The indicators I'm using, are they flawed in anyway when looking at a 1min chart as oppossed to a 15min or a 1 day, etc?)
Picture Legend:
Red Arrow - approx entry
Blue Arrow - approx closing
Green Circles on the chart - areas of suppor
Green Circle on MACD - MACD crossover seemingly identifying a possible uptrend
Green Circle on RSI showing the market undersold and identify a possible long position


