stoploss please
Established member
- Messages
- 780
- Likes
- 10
Hi
If you were to plot a group of different length MAs on a chart, the increase in distance between the short MAs and long MAs will indicate strength in the current trend.
Furthermore, increasing differentials in the same MA length over consecutive closing periods would indicate momentum acceleration and strength in the current trend.
ie Trend strength = if value of Current MA close / Previous MA Close is greater than
value of Previous MA close / MA close of three periods ago.
Question?
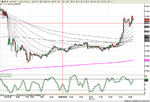
You will find a chart of the emini set at five minutes over a continuos time frame. The chart has been plotted with fibonacci length EMAs.
I want to value the length of the differential of all these averages over both
the same closing period.
the previous closing period.
I need a hand with the math. Anyone interested.

