Market Profile

Splitlink

Legendary member
Messages
10,850
Likes
1,236
Anyone got experience with Market Profile? I've been playing with it and SP500 this afternoon for 50p per point. Trying to work something out but I lost 12 points. Market's been a bit choppy this afternoon and went up. I worked out the value area, put 80% on each side of that and when it went up, shorted as I was pessimistic of the market . Sure enough it went down 7-8 points, then went up again and I lost all that, as, being pessimistic I held for a while.:) A new hump formed, higher up, which denoted a new, higher fair value and, of course, the 80% limit had to go higher, too. Can anyone tell me if that is the clue that a higher level is coming? and that positions should be closed when that occurs?

I'm not trading seriously as I didn't feel like it but I saw, afterwards, that a cute double bottom formed, which if I had been following normal routine, I would have acted upon. So I am wondering whether MP beats normal chartwork and whether many use it?

Split
 
Split,
I looked at it ...CBOT I think and I got the book from the library blah blah....basically when you make money consistently it's because you have correctly put together the tactics that suit the type of market you are in.. thing is you can make money doing that with straight MA's... the common denominator is recognition of market type and alignment with appropriate tactics.
 
Looked at it a few years back. Bought the book, did the research, played around. An innovative approach and style.

What was useful was the process of coming up with a derivative of it which factored in Volume at well as Time at each level.

But when all is said and done, it’s just a reconstitution of the base data and once you’re working OK with that, any representation will serve as well as any other.

I ended up with bars and volume…not very flashy I’m afraid.
 
Thanks for the posts. I suppose I should give it more time than just one afternoon, but that double bottom and the reverses---- I think I could have made something out of them if I had been watching.

Split
 
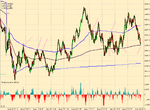
Here is a chart of yesterday's ES with constant volume bars (5000 contracts wide).

The blue bands are such that 70% of the traded volume lies between the bands, 15% above and 15% below. As such they are very much like MP VAH and VAL. The black line is the session VWAP. It is my observation that traders "take notice" of these levels in many stock index futures.

As with all such things, you can draw random lines on any chart and get "support and resistance" which is just by chance. Over a period of time my observations tell me that it's not just chance with MP levels, but that doesn't mean there is any simple minded way of making money out of them.

The other plot is a smoothed "market delta" - the difference between volume at ask and volume at bid. I think this is very usefull and a hell of a lot easier than staring at T&S. Notice the declining delta towards the HOD. Though a substantially finer grained chart than this is needed to see the real benefit. In conjuntion with the order book, this can be very powerful.
 

Attachments

  • es_5000contracts.png
    es_5000contracts.png
    29 KB · Views: 323
Last edited:
Here is a chart of yesterday's ES with constant volume bars (5000 contracts wide).

The blue bands are such that 70% of the traded volume lies between the bands, 15% above and 15% below. As such they are very much like MP VAH and VAL. The black line is the session VWAP. It is my observation that traders "take notice" of these levels in many stock index futures.

As with all such things, you can draw random lines on any chart and get "support and resistance" which is just by chance. Over a period of time my observations tell me that it's not just chance with MP levels, but that doesn't mean there is any simple minded way of making money out of them.

If one is drawing random lines, it is unlikely that they will provide support and resistance.

Market Profile is based on auction market theory, as are support and resistance, i.e., one can expect to find support where the most substantial buying has occurred in the past and resistance where the most substantial selling has occurred. Rather than draw "random lines", one can use "volume by price" (available for free online) as a guide. Doing so can also enable the trader to plot his strategy ahead of time.

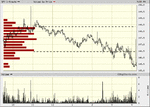
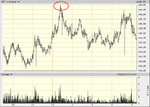
Here, for example, is a chart similar to yours, only from Thursday. Note that nearly all the trading has taken place between the bands. Here, then, is where one can expect support if price opens above this zone on Friday, or resistance if price opens below:

attachment.php


Which is what happens:

attachment.php
 

Attachments

  • Image3.gif
    Image3.gif
    27.6 KB · Views: 1,489
  • Image5.gif
    Image5.gif
    37 KB · Views: 1,408
Anyone got experience with Market Profile? I've been playing with it and SP500 this afternoon for 50p per point. Trying to work something out but I lost 12 points. Can anyone tell me if that is the clue that a higher level is coming? and that positions should be closed when that occurs?

I'm not trading seriously as I didn't feel like it but I saw, afterwards, that a cute double bottom formed, which if I had been following normal routine, I would have acted upon. So I am wondering whether MP beats normal chartwork and whether many use it?

Split
With Esignal I use price profile, but I'm not trading intraday yet. The levels are there , one needs to record them daily and follow the action, repetitions occur that one can trade with. It's definitely not everything , but an added tool in the toolbox. How else can one trade if he/she/or it doesn't have some sort of framework or structure?

erie
 
Here, for example, is a chart similar to yours, only from Thursday. Note that nearly all the trading has taken place between the bands. Here, then, is where one can expect support if price opens above this zone on Friday, or resistance if price opens below:

There is a difference. The chart I posted shows the development of "MP" levels during a trading session. The volume profile overlay type chart you posted shows volume profile for the completed previous session, which is a more conventional use of MP concepts. I think there is merit in both.

I think it is true to say that each trading session has it's own internal drivers in addition to the longer term context and in particular the context of the previous session. As one example, extensive VWAP trading in the stock market no doubt has a two way interaction with the futures contract prices in the corresponding index.
 
There is a difference. The chart I posted shows the development of "MP" levels during a trading session. The volume profile overlay type chart you posted shows volume profile for the completed previous session, which is a more conventional use of MP concepts. I think there is merit in both.

I agree there's a difference. That's why I said "similar". Noting in real time the development of those zones in which price is most heavily traded is of course useful, but one has to wait for those levels to be established before one can take advantage of them, at least in this context. And without noting the "value area" established the previous day, there would have been no reason -- again in this context -- to short the high.
 
It is worth noting that Bolter (ref prior page) doesn't currently trade Market Delta (best suited to short term scalps) or Market Profile. He is using simpler trend orientated methods.
 
Top