1
12WBT
Took up an interest in market correlation back in 2005 when I used to trade share CFD’s with MF Global.
Started collecting the variance on BHP(BLT in London same company) and RIO from London to Sydney. And after a period of time started to go long BHP and RIO in London and short BHP and RIO in Sydney. Or vis versa and sometime’s only one company based on variation. This was all done on a spread sheet which also calculated the variance of the AUD/GBP or GBP/AUD to give the true variance.
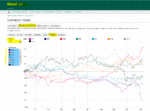
Can be done on a chart but this will not allow for the currency variance. Plus I find excel is a lot more precise in seeing price than a chart.
Stopped trading share CFD’s about 2007/08 when the GFC was on, and short selling was banned in Australia. Ban was for a lot longer period in Australia than the UK. Very hard to trade when the only option to go long when everything is heading south.
In the next post will talk about what instruments you can use in market correlation.
And then go on how I discovered what a member on T2W was using a few years later which I looked at and just broadened that approach. Which I have used every day now few a years now with a couple of other separate trading techniques,
Or you might say I stole and added my thing, well I am in Australia now.😆
And also later on put some spreadsheets up showing market correlation during the year.
And hopefully getting other people talking about this subject, have noticed some posts where people mention using this.
I would say this is no holy grail system and requires thinking and a judgement call when to take a position.
But offers a high probability strategy if you do the work.


