Does there exist anywhere online a schematic map showing net public debt exposure between major economies? Here's information about who owns US debt http://www.treasury.gov/resource-center/data-chart-center/tic/Documents/mfh.txt but that doesn't give the net figures and a map with arrows could display this very well. It would be a very helpful overview to have but I haven't been able to find one. Or am I being simplistic?
You are using an out of date browser. It may not display this or other websites correctly.
You should upgrade or use an alternative browser.
You should upgrade or use an alternative browser.
Martinghoul
Senior member
- Messages
- 2,691
- Likes
- 277
Here you go:
http://www.bis.org/statistics/consstats.htm
http://www.bis.org/statistics/consstats.htm
scose-no-doubt
Veteren member
- Messages
- 4,630
- Likes
- 954
never mind p*ssing around with BIS stuff get your thread on the go!! 😀
Martinghoul
Senior member
- Messages
- 2,691
- Likes
- 277
scose-no-doubt
Veteren member
- Messages
- 4,630
- Likes
- 954
I didn't get to sleep until after 3am. I'll likely be talking utter sh1te all day. Ignore for the time being.
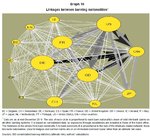
Huh, scose? Also, since you been looking for a pic, I have attached one. To be sure, this is not just sovereign debt.
Thanks, that's the sort of diagram I was thinking of, although it would be better if it showed net exposures so there was only ever an arrow in one direction between two countries. Also as you say it's not sovereign debt and it doesn't include China.
I read all these figures about the terrible size of countries' government debts but it's hard to get a handle on what the net figures are. There seems to be a lot of mutual borrowing and lending. Apparently there are no records of which countries own UK government debt http://news.bbc.co.uk/1/hi/business/8530150.stm so I suppose the chart I would like to see can't be produced.
Martinghoul
Senior member
- Messages
- 2,691
- Likes
- 277
You won't find Chinese data. China doesn't report the sort of stuff that you want, so, at best, you can get some random guesses from "experts".Thanks, that's the sort of diagram I was thinking of, although it would be better if it showed net exposures so there was only ever an arrow in one direction between two countries. Also as you say it's not sovereign debt and it doesn't include China.
I read all these figures about the terrible size of countries' government debts but it's hard to get a handle on what the net figures are. There seems to be a lot of mutual borrowing and lending. Apparently there are no records of which countries own UK government debt http://news.bbc.co.uk/1/hi/business/8530150.stm so I suppose the chart I would like to see can't be produced.
As to looking at just sovereign debt, the BIS data that I have pointed you to does split out the "public sector" exposure. So if you want to see what it looks like, download the CSV file from the BIS site and do the arithmetic yourself.
Finally, the BBC article is incorrect. The BIS has statistics on who the foreign holders of gilts are.
OK, thanks. I'll have a look at that.
I also had a look at a table of net international investment positions on wikipedia http://en.wikipedia.org/wiki/Net_international_investment_position which of course is public and private debt. Two things I noticed:
1. I went through the figures for the 28 countries with the highest GDP, worked out their NIIPs in $ and added them up. It gave a figure of +$7.25 Tn. That suggests either a lot of smaller countries have significant negative NIIPs (maybe) or some countries are lying about their positions.
2. I'm surprised Australia has such a bad NIIP figure. Why is that?
Martinghoul
Senior member
- Messages
- 2,691
- Likes
- 277
Well, I don't think it's a matter of lying, tbh. I think that the countries that are not included in the table probably contribute the balance.
As to Aussie, it's a well-known issue. Aussie has been a "beneficiary" of a lot of foreign inflows of capital, especially from China. Just like with the US, it means that you end up with a whole bunch of assets that are funded externally. In the case of Aussie (and you might have heard the stories), it's housing and all that this implies (i.e. offshore funding of domestic banks, etc).
As to Aussie, it's a well-known issue. Aussie has been a "beneficiary" of a lot of foreign inflows of capital, especially from China. Just like with the US, it means that you end up with a whole bunch of assets that are funded externally. In the case of Aussie (and you might have heard the stories), it's housing and all that this implies (i.e. offshore funding of domestic banks, etc).

