Hello All,
Been a lurker for quite a few months now and have been reading the threads by Dan and Trader Dante (thanks guys for your wisdom :smart🙂 and believe I can now put their points as well as some of my own into practise.
I spreadbet on the IG platform (will look at FTSE and CABLE to start with) and have been doing so for the last 5 months or so. I have had little or no strategies before which has led me to entering and exiting trades at the wrong points, not looking for any technical indicators and running my stops too tight. Basically leading my account into a large negative.
Most of the mistakes were made by me being lazy and feeling that I always needed to in a trade rather than waiting for the right set-up. I know its a common mistake but I hope that setting up a thread will help me become more disciplined as it will be for my benefit as much as to anyone else's.
If any of you know how to paste IG charts into here then please let me know otherwise I will simply be posting a written description of trades I have opened.
Thanks in advance.
First Trade.
LONG FTSE @ 3964
STOP @ 3926
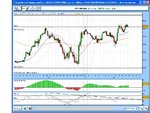
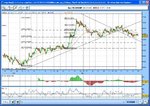
Signs were that the resistance at this level would be broken and I waited for the price to move higher before entering. The previous bounce off this resistance level wasn't as strong and the RSI was also trending higher which showed me a break-out would be on strong momentum. GBP/USD was also showing me a breakout of a triangle formation which gave me 3 signs to show me a LONG entry was to be taken.
🙂


