Just a Note,
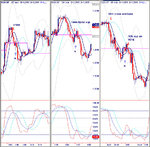
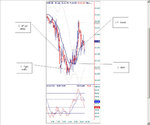
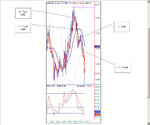
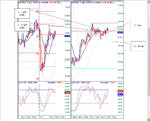
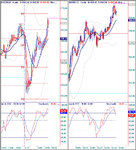
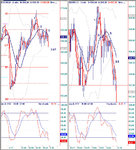
As not to get the wrong impression from this thread and everything that I've posted I want to post the screens that are directly in front of me when I trade. I'll post these below. I have 6 monitors with 2 directly in front of my face and these are on them. Several questions have been asked about the RZ averages and I will use them in certain circumstances always FX related. I came up with the RZ averages and their use to help deal with the trendiness of FX and at times I'll use these exclusively but rarely will they be directly in front of me. What I've posted below remain in front of me. I wanted to make this clear and in spite of my experimentation with other indicators relative to my method my main method screens remain up and intact.
Regards,
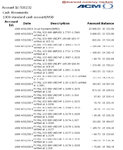
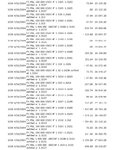
I traded an ACM demo account for 5 days to demonstrate the effectiveness of this approach. Money/Trade management guidelines were 30:1 general trade size to account equity which started at 20,000 USD with risk dictated by entry premise. Also I imposed an aggressive 5-8% of account equity as a daily goal. Results posted below.
This is a simpler follow up to a previous thread I had posted. As for the previous thread I realized it was so full of jargon that it was relatively useless to others so I pulled it. Sorry about that. This is the same methodology but focuses on the larger timeframe moving averages cross.
5pdw = 5 period weighted moving average
RZ5 = a moving average of the Highs and Lows of the last 5 bars and shifted up
RZ15 = a moving average of the Highs and Lows of the last 10 bars, displaced 5 bars and shifted up
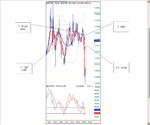
For an example I'll show the 377m 5pdw/RZ5 cross down. I'm interested in a trend that respects the support or resistence of the RZ5 moving average with the notion that all of the trends in the correct timeframe will respect the RZ5. So in this case the 377m 5pdw/RZ5 cross down to initiate the downtrend shows up in the 89m RZ5/RZ15 cross and base entry short and/or a trigger entry off of the 21m RZ5/RZ15 cross/base/breakdown.
Now that's the entry off of the cross with possibly more volatility to deal with than an entry off of a blue candle in an established downtrend. If we take a look at the first blue candles in the same 377m 5pdw/RZ5 downtrend it/they show up as a 144m 5pdw cross above RZ5 and on the 89m an RZ5 cross above RZ15. In the previous thread I mentioned an mini inverse1 , well there it is in the stoch showing up in the 144m 5pdw/RZ5 cross up off of the 377m downtrend blue candle. The 144m mini inverse1 IS the 377m blue candle in the ongoing 377m downtrend.
So the main point is the up/downtrend that respects the support or resistence of the RZ moving averages follows thru nicely and with the notion that good trends respect the moving averages our risk is defined by the upper boundery of the slower moving average after being crossed which represents the higher timeframe immediate directional trend. If the boundary is breached we can make the conclusion that the move we've entered is not the kind of trade we want and not be teased into whip action and with very limited risk. If the move continues we trail the RZ15 on the correct timeframe to the cross exit which is the duration of the higher timeframe 5pdw/RZ5 trend
Note: The trades in the demo were done off of the 1 minute and 3 minute charts, and utilizing the 8, 13, and 21 minute timeframes.
Attachments
Last edited:

