JTrader
Guest
- Messages
- 5,741
- Likes
- 507
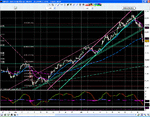
Here is a lovely example of a GBPUSD uptrend on the H4 chart.
In hindsight, From the 2 trend-lines we can see that it is possible to have traded this move profitably from the start around 7th June, right up to around 25th July, using a few simple trend-lines.
I have never liked/used drawing object indicators, because -
1) There is a subjective element in deciding where to draw the lines.
2) Drawing the lines is a manual process.
3) Managing the trade is a fully discretionary process.
4) Combining the subjective manual drawing of lines, with the discretionary trade management could create confusion, and induce a lack of discipline. i.e. when the trend line is broken in some way, instead of exiting, it would be possible to tweak the angle of the trend-line slightly, lowering the right hand side of the trendline, ensuring that price was still above the trendline, and you still had reason to be in the trade!
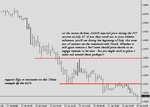
What i would like to know is, how could/should/would a trader going about trading this uptrend, using trendlines similar to the two trendlines that have been drawn.
If this uptrend had been successfully traded from start to finish, for obvious reasons, it would seem best to have traded this trend in as fewer round turns as possible.
What do you think would have been the best way to have traded this move?
How many times would you have exited a trade, before re-entering (presumably long), and on what basis would you have exited, before re-entering?
How many trendlines do you think you would have drawn to cover the curation of this uptrend?
Many thanks 🙂 .
Attachments
Last edited:


