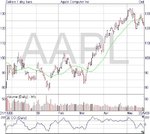
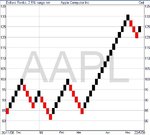
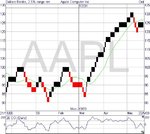
I am working with Kagi in Prorealtime since time ago and I have detected a mistake which could make their kagi charts useless because it affects indices and any kind of stocks:
1. The kagi line is ascending (yang) for days and, when one day it changes to descending (ying), the previous days which were marked as ascending days (yang) before this change are marked now as dsecending (ying).
2. It occurs always when the change of price was strong. If price change less strong the mistake does not occur.
For example:
1. CAC 40: It is in ascending line (yang) up to june-15 included. On june-16, price go down and kagi line change to descending (ying). Then, kagi chart indicates that the previous days up to june-3 (marked before as ascending days) are now descending days. To sum up, the day of change is not june-16 but june-3.
2. Arcelor (MT.AS): In ascending line (yang) up to june-16. On june-17, price goes down and the kagi line change to descending (ying). Now the complete kagi chart change and shows that the kagi line is descending since june-12 (not since june-17). To sum up, the first day of change is june-12, not june-17.
In my system, it is very important to detect the first day of change. As you can understand, if you are waiting for the first day of change for buying/selling and, when it occurs, kagi graph change completelly and tell you that the first day of change was not this day but days ago, the whole system is useless.
I have wrote to Prorealtime support and I am waiting for their comments. If any of you know where is the problem, please, let me know it.
Thanks,
Javier


