I appreciate i do not post often, and I doubt that will change in the future, as my only priority when trading is to have a profitable day, after that i am free to enjoy the rest of the day.
However I will post a few charts now and then with explanations of why I took a trade.
It may seem like teaching Granny to suck eggs for the seasoned profitable traders, thus this thread is more aimed at people looking at a different style, that may enhance their trading.
I only trade Cable, on a 1 min time frame, and the only indicator I use is a horizontal line.

I was at my computer for 06.50, and looking at the charts from 06.40 I thought maybe we would be having a long day, however this was just a thought, as no empirical technical evidence was proving my thought.
Then from 07.00 the market started moving down, so now i am thinking maybe we will be having a down day, again this was just a thought as no evidence to prove this was made available(one of the hardest things for me to have over come is being quick to change my mind on direction, sometimes in the past all counter evidence was ignored,as I wanted to be right in my directional analysis, however losing money on a trade is quick to teach you otherwise).
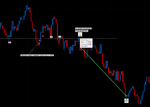
A dotted white line was drawn showing support, followed by resistance, then support again, thus notifying me that the only evidence I have to hand is for a short trade. I jumped in early with a tight stop knowing if i get stopped out, 5 pips is not the end of the world, in the grand scheme of things.
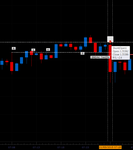
Price broke through at 07.58, so now i am thinking about any possible outcomes that may mean I was wrong, and a long trade was on instead.
the solid white line showed a double bottom, and now i am thinking, I may be wrong, however, for this to be so, I thought the white dotted line must be broken to the up side, and if that was the case, I would close the trade before my stop is hit, maybe with a loss of 3 pips.
However price hit the white dotted line, proving resistance again and went short. Price then broke through the solid white line, and capitulated enough for me to know I was in a short trade.
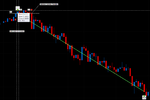
A 1:5 R:R was achieved quite quickly, and I decided to hold on to the trade, a 1:10 R:R was hit withing 30 mins, and i decided to hold on, price reversed, but not enough to worry me, as I knew I could move my stop to break-even and not lose anything on the trade.
I decided to pull out when 1:11(55.1 pips)R:R was reached, for no technical reason at all, but just thought that was enough, and that is me done for the day.
I appreciate that every day isn't going to be this straight forward, and a method may be simple in principal can be hard to execute, but I'm a firm believer in the law of 10,000hrs, and I would say I have put many a hour at the charts.
Feel free to ask any questions.
Best
John.
However I will post a few charts now and then with explanations of why I took a trade.
It may seem like teaching Granny to suck eggs for the seasoned profitable traders, thus this thread is more aimed at people looking at a different style, that may enhance their trading.
I only trade Cable, on a 1 min time frame, and the only indicator I use is a horizontal line.

I was at my computer for 06.50, and looking at the charts from 06.40 I thought maybe we would be having a long day, however this was just a thought, as no empirical technical evidence was proving my thought.
Then from 07.00 the market started moving down, so now i am thinking maybe we will be having a down day, again this was just a thought as no evidence to prove this was made available(one of the hardest things for me to have over come is being quick to change my mind on direction, sometimes in the past all counter evidence was ignored,as I wanted to be right in my directional analysis, however losing money on a trade is quick to teach you otherwise).
A dotted white line was drawn showing support, followed by resistance, then support again, thus notifying me that the only evidence I have to hand is for a short trade. I jumped in early with a tight stop knowing if i get stopped out, 5 pips is not the end of the world, in the grand scheme of things.
Price broke through at 07.58, so now i am thinking about any possible outcomes that may mean I was wrong, and a long trade was on instead.
the solid white line showed a double bottom, and now i am thinking, I may be wrong, however, for this to be so, I thought the white dotted line must be broken to the up side, and if that was the case, I would close the trade before my stop is hit, maybe with a loss of 3 pips.
However price hit the white dotted line, proving resistance again and went short. Price then broke through the solid white line, and capitulated enough for me to know I was in a short trade.
A 1:5 R:R was achieved quite quickly, and I decided to hold on to the trade, a 1:10 R:R was hit withing 30 mins, and i decided to hold on, price reversed, but not enough to worry me, as I knew I could move my stop to break-even and not lose anything on the trade.
I decided to pull out when 1:11(55.1 pips)R:R was reached, for no technical reason at all, but just thought that was enough, and that is me done for the day.
I appreciate that every day isn't going to be this straight forward, and a method may be simple in principal can be hard to execute, but I'm a firm believer in the law of 10,000hrs, and I would say I have put many a hour at the charts.
Feel free to ask any questions.
Best
John.
Last edited:


