jungles
Guest
- Messages
- 614
- Likes
- 67
Apply the indi attached, to a 60M chart, using these settings: 240, 60, 0, 0, false.
Scan 60M charts looking for those pairs where price is clearly away from the SMA and the SMA is sloping (up when buying, down when shorting).
If price is > SMA, only buy; if price is < SMA, only short.
Using 240M draw up horizontal support/resistance; I use price pivots to do this.
Ensure 60M price action supports the direction of your trade.
Apply 1:1 risk:reward.
Place SL above/below price pivot (~10 pips).
TP above/below support/resistance (~10pips).
The guideline above is straightforward……..however, skill is required to interpret price action and mark up support/resistance.
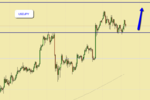
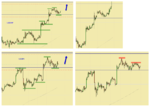
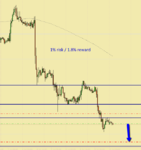
An example below.
Good luck, now go forth and prosper. 😀
.


