JumpOff
1
- Messages
- 702
- Likes
- 14
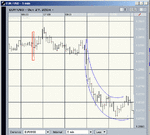
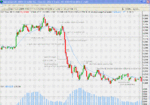
I've looked in a few different books about charting and TA, and can't really make any of those labels fit this pattern, although I see it happen pretty regularly in the EUR/USD. Todays pattern was down, but of course I often see it going the other way too...
The upper and lower bounds of the price action generally follow a path similar to the 2 blue arcs I've drawn on the chart - I know some of the price isn't completely contained in those arcs, but hey - I'm not an artist....you get the idea..
Is there a name for this? It most often comes after a breakout, and the first part along the left edge of the chart is often much steeper than today's example, and it most often just loses steam and enters a sideways channel about 8-15 pips wide....
Today's action came after a reversal and instead of going sideways ,continued to make a rounded bottom and the price retraced nearly to place it was when the reversal occurred.
Thanks,
JO.

