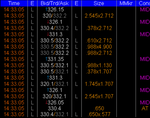
Hi
First post. I've spread bet for about about a year - out of interest and education.
I got stopped out this week on a FTSE350 (Bodycote June) future trade when the price supposedly dropped to 315p on the 29th. When looking at the charts though, the lowest the bid hit was 318.4p. I hadn't seen this size of an anomaly before so questioned it with the broker and they showed a Bloomberg screen which supported what they said . My question really is how common is this sort of chart/price differential as 3.4p (on 315p) seems quite large. Also, if trades can be executed at these prices why can't charts accurately represent them? I'm curious. Are less liquid instruments more susceptible to this? Thanks

