I need help

xtreme28

Newbie
Messages
2
Likes
0
Hi, I need help, I lost a trade, and I want to know what I did wrong, please
:(
 

Attachments

  • USDJPY_2024-10-15_21-47-05.png
    USDJPY_2024-10-15_21-47-05.png
    215.5 KB · Views: 16
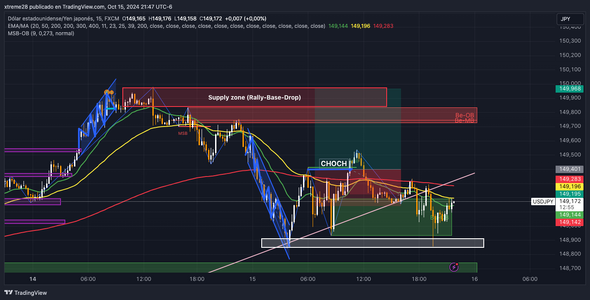
Where the 2 lines cross on the charts that I posted is basically where you took the trade. The gray area represents the range on the 1 hour chart. Your buy trade was taken on the 15 minute chart.

When viewing the charts, keep in mind that support/resistance are not well represented by a single price point, a single line drawn across a chart. Support and resistance are areas. These areas may be narrow or wide.

Always be aware of the big picture of where price is on the charts.
 
First, it is hard to buy at a high price and then sell for higher. Look at the 1h chart. You entered at the top of the range. You bought high expecting to sell higher. Tough to make money that way.

1729383885263.png
 
Next is the daily chart. You bought with a nice upward move on the daily, but price can only go so far before it pulls back. Price entered an area of resistance on the daily where there is likely to be profit taking - selling - which will likely drive price down. Pullbacks are inevitable. This is not an area I would consider taking a buy trade. Looking at the hourly and daily, your trade was high risk. Your entry was not the best area to go long from a technical setup perspective. Buying into resistance can be difficult trade.

1729383973748.png
 
Going further for fun, look at the monthly. The range on the 1 hour chart is acting as an area of support and resistance on the monthly chart. It has been acting as support and resistance since the 1980’s. A lot of buying and selling here as well as price rejection, for a very long time. A lot of attention given to this area. Something I would want to be aware of.

1729384064743.png
 
Looking at all 3 charts where you took your trade, these are all areas where pullbacks or reversals are likely to occur. Your trading approach should be tempered accordingly.

This is also an example of confluence between timeframes. Possible entry confirmation. Or a warning to stay out of the market. How you view the data depends on your trading approach.
 
The price broke the trendline, I thought it was doing a break and retest to go in reversal
or I was going to exit on the marked support

21Oct.png
 
You are traded against the trend which typically has a lower success rate. I will trade against the trend but I usually have a very good reason for doing so. With a trend you want to wait for a pullback and then enter in the direction of the trend. Trading at the top of a trend in anticipation a pullback/reversal which you did here is a more difficult trade especially for newer traders.

Before taking a trade you need to ask yourself why. If you do not have a good answer do not take the trade. The why is not found in technical analysis.
 
You are trading the USD against the JPY. You need to know why the USD will strengthen or weaken against the JPY and why the JPY will strengthen or weaken against the dollar. If you cannot answer those questions you should not be trading the currency. As an example, look at the dollar. The market was pricing in a 50 basis point cut at the next federal Reserve meeting. The strong recent jobs data is indicating that a 50 bps cut is no longer likely. The markets are now pricing out the 50 basis point cut. This is causing the dollar to strengthen and trend upward. We know why the dollar is trending up. The trend is caused by fundamental data not technical data.

Looking at sentiment. A Trump presidential victory in the United States is seen as positive for the dollar. Some of the large hedge funds are now starting to positioning for a Trump victory. They are buying the dollar which is an additional reason for dollar appreciation and adding to the upwards dollar trend. If Trump wins you will likely see a further increase in the dollar for a short time. The win will get priced in. Fundamentals should then take over with the dollar reducing in value due to the continuation of the Federal Reserves interest rate cutting cycle. This makes for a potential nice short trade setup. The dollar is being driven higher prior to its expected decrease in value. This is an example of a reversal I may have a good reason to trade. If Harris wins the election you will likely see the dollar fall off sharply. Probably a sell off on the news of a Harris win. The data may change, and if it does so will the outlook for the dollar.
 
Notice the trend, its direction and possible turning point have nothing to do with technical analysis. I have a trading plan with some understanding of how the market may respond well in advance. I know the reason for the trend and its direction. I know what is pushing the trend higher. I can expect a more immediate/sharper reversal/sell off of that trend if Harris wins. If Trump wins I can expect the dollar to continue to strengthen some and then a reversal due to the continuation of the Fed’s interest rate cutting cycle. There is some prediction as to when the trend will end and why. This information allows me to trade on the right side of the market. Information I can think with. Because I have some understanding I can change my bias and modify my trades as indicated. When I am confused or not sure what is going on I don’t trade. Who knows what is going to happen in the end. This I do know. I win many more trades for many more pips on average per trade using fundamentals than using technicals alone. If you want to be successful trading you need at least some understanding of fundamentals.
 
Top