Hello Everyone,
This is my first post to this forum...i am a novice trader ( started January this year )...so don't be hard on me..🙂
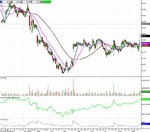
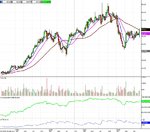
Ok...i have atached a daily and weekly chart of NASDAQ: CERN ( Cerner Corporation ).
Let's start with the daily chart. As you can see since May the price was bouncing up and down in a tight chanell with a high of 48.75 in june.
On last week Friday boom big gap up...intraday up till 50.00 down till 48.75 ( june high...coincidence?..maybe ) and closes at 49.34
Volume is on our side so this should be a long signal.
Now if we look at the weekly chart we can see that the last week close is the first time when prices close above 50 week moving average ( the brown line ) this year..another long signal i may say.
However i see a major resistence line around 50 on the weekly chart and i suspect it won't be an easy one to break.
You can see now my dilema?...i want to enter long but i am unable to see a good reward/risk entry point...


