how do you exity a trade?

Christiaan

Active member
Messages
227
Likes
10
hey guys

I would like to know how you exit a trade.What indicator do you use or do you use a predermined profit target that remains the same?I would especailly be intersted in how you exit a trade with the sniper system.Did you change anyhting or add a indicator that gives better exit signals

how do you do it?

thank you
 
Let's have a bitty ditty about thisy till we hitty or we missy as long as we try to be witty.
 
hey guys

I would like to know how you exit a trade.What indicator do you use or do you use a predermined profit target that remains the same?I would especailly be intersted in how you exit a trade with the sniper system.Did you change anyhting or add a indicator that gives better exit signals

how do you do it?

thank you
I use multiple exit options simulataenously, whichever triggers exit first closes.

Trailing stop

dynamic stop

profit lock stop

end of day

exit manager

profit manager

dynamic profit target manager

resistance exit profit

There are other options

emotional stop

greed exit

fear exit

The latter are for novices
 
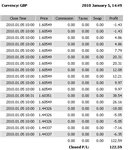
Today's fear closures.I interfered with an algo and closed it at 10 am, 300 pips worse off.Thats what manual traders do all the time,
 

Attachments

  • fear closure.jpg
    fear closure.jpg
    56.3 KB · Views: 362
hey guys

I would like to know how you exit a trade.What indicator do you use or do you use a predermined profit target that remains the same?I would especailly be intersted in how you exit a trade with the sniper system.Did you change anyhting or add a indicator that gives better exit signals

how do you do it?

thank you
i wouldnt use a predermined profit target myself as markets are dynamic and information changes.. if your a technical trader then maybe the signal that gets you in should get you out?.. personally I will close my position when I have lost so much money that my left eye starts to twitch!
 
i wouldnt use a predermined profit target myself as markets are dynamic and information changes.. if your a technical trader then maybe the signal that gets you in should get you out?.. personally I will close my position when I have lost so much money that my left eye starts to twitch!


I agree that if a TA signal gets you in, TA should get you out, but it need not be the converse of the entry signal. Its is a common failing of academic studies of TA that they use a largely discredited TA signal for entry, such as rising MA crossover, then the converse signal, such as a falling MA crossover, as the exit signal. If the entry is late, which it will be, the exit is years behind. This is bonkers.

But surely, we should be identifying the the level or pattern that would get us out before we go in? Because the only point of trading is to make a good exit.

Best post I've seen for ages !
Richard
 
I agree that if a TA signal gets you in, TA should get you out, but it need not be the converse of the entry signal. Its is a common failing of academic studies of TA that they use a largely discredited TA signal for entry, such as rising MA crossover, then the converse signal, such as a falling MA crossover, as the exit signal. If the entry is late, which it will be, the exit is years behind. This is bonkers.

But surely, we should be identifying the the level or pattern that would get us out before we go in? Because the only point of trading is to make a good exit.

so which T.A methods actually give price targets ?.. I know a break of parallel trend lines gives you a target..P&F charting also gives you a target.. are there any more? aren't most of the others lagging indicators?
 
All indicators are lagging indicators as they are based on past data
If you want a predictive indicator use fibs tied up with price action.
 
Most methods based on Market Geometry will give you price targets.
So for instance patterns like flags, pennants, triangles, H&S, triple tops, ...
Then you have the Fibonacci-based methods, be it retracement, extension, arcs, or fans.
Gann angles will also give you a set of targets.

On another hand, time-based methods also give you price targets, albeit this time the target is not known before it is triggered by the temporal factor. E.g. followers of cycles may enter and exit at two consecutive lows depending on the frequency used.
Gann followers may use a Gann wheel to decide on targets and exit when price has completed a 360degrees cycle.
Fibonacci cycles also exists.

Finally, price action-based charting methods can be tuned to avoid lagging issues or at least respond efficiently according to one's own money management standards. E.g. Renko or Three Line Break charts.

:)

Says it all, really.
 
Most methods based on Market Geometry will give you price targets.
So for instance patterns like flags, pennants, triangles, H&S, triple tops, ...
Then you have the Fibonacci-based methods, be it retracement, extension, arcs, or fans.
Gann angles will also give you a set of targets.

On another hand, time-based methods also give you price targets, albeit this time the target is not known before it is triggered by the temporal factor. E.g. followers of cycles may enter and exit at two consecutive lows depending on the frequency used.
Gann followers may use a Gann wheel to decide on targets and exit when price has completed a 360degrees cycle.
Fibonacci cycles also exists.

Finally, price action-based charting methods can be tuned to avoid lagging issues or at least respond efficiently according to one's own money management standards. E.g. Renko or Three Line Break charts.

:)
Hey brilliant.. cheers for that.. you have a talent for getting alot of good info across in not alot of words.!:clap:
 
Top