Hotch
Experienced member
- Messages
- 1,409
- Likes
- 256
"Now there's all kinds of different people in this world, there's only one pie, and we're all fighting for one little piece."
Introduction
*crosses fingers*
My last journal, I promise.
I have been informed, that much like women, I flirt with too many strategies and never give one enough of a chance. Much like women, this is normally because I forget where I was going with them. So this journal will be the place where I collate my thoughts (not on women), and will be my base camp if I ever get lost. This won't be trading calls or anything, just my approach to trying to get a strategy.
Unlike most of my trading, I am starting with targets. These aren't really based on how much I would like to make, but more on what I feel is statistically significant.
1-Sharpe Ratio >= 2, with risk free rate being 0.
2-5R/week over all instruments
3-Expectancy > 0.3
Of course, 2&3 are related, if my expectancy is 0.3 then I'll want 17 trades a week.
These are targets, I doubt I'll reach them, but one can buy try.
Now, first thing that everyone here should know, but nobody seems to, is what retail trading is all about. It is not about buying lower than you sell. It's not about finding changes in direction. IT IS about finding a level A which price is going to reach, before it hits level B.
So how do we go about finding these levels? Well, we need to know:
1-Where price is going to go.
2-Where price isn't going to go.
We'll start with 1.
For now, I am going to approach this with the traditional hard and fast rules, everyone seems to trade by, and see where that takes me. So, we'll start with the big one.
Chapter 1- The trend. (If we we're going up yesterdayday, we're probably still going up today)
The vast majority of trading theory is based upon the simple idea, that if price is moving up, it will continue to move up more often than not. This is surmised in that saying:
"The trend is your friend til the bend at the end."
In layman's terms, there's always going to be some poor ******* who buys with the trend at the very top, but all others buying with the trend have an opportunity to get out at a higher price than entered.
Now, I have previously pondered whether this is a good place to start, and I have had varying degrees of success starting with other axioms, but this is my most recent angle and I will stick with it as I have been told to.
1.1 How to define the trend.
Most people will tell you that a bull trend is comprised of higher highs and higher lows, while a bear trend is comprised of lower highs and lower lows, the rest is consolidation, noise and can be ignored as better conditions can normally be found. This is fine, but I am yet to find somebody who will define for me what a high or low is.
People will point them out on a chart, and exclaim as to how obvious it is, but if you try to get them to define the actual criteria, none are able to come up with one which:
a) agrees with the places they pointed
b) shows nice trends.
Most approaches seem to get one in trends too late, or out too early. I have not solved this problem. However, I hope to cheat, but defining the trend on larger time frames, and find entries on smaller time frames (another well loved idea).
So how to define something, which seems obvious to people, and yet impossible to quantify?
Well, several possibilities are available, one which is saved for another day. The others are steal someone else's thoughts, or come up with my own approach, unsurprisingly, we're going with the latter.
First thing to realise, is that, like most things, it's bull****. See, there are these things called pullbacks. They are bull trends within bear trends and bear trends within bull trends. That's right, the trend is bullish and bearish at the same time. Once again, it comes down to time frame, or more precisely, how many bars you're looking back.
This means, we're always going to get some wrong. Another thing to note, is that it doesn't really matter what approach we use at this stage (it's the first thing to pick, everything can revolve around it), much like it doesn't matter whether you use the 200 EMA or the 201 EMA.
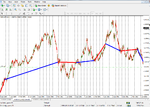
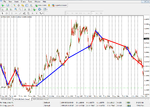
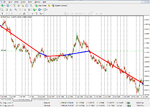
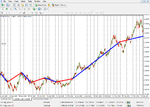
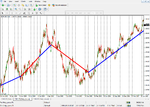
Already my trail of thought is unwinding so I shall leave you with my current approach to finding the trend. Note that it's not the net pip's made, or the amount of time it's right/wrong, or anything which makes or breaks it, it's the combination of all the parts.
Hotch
xxx

