H&S in the DJIA?

TrendTracker

Member
Messages
72
Likes
0
Hello all,

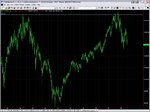
DJIA seems to be forming a huge head and shoulders market top. It seems that if we don't get a turn around from here (in the light of fundamentals there's not much hope) the H&S completes and the projection's at least to DJIA 10 000, and even below.

Take a look at the chart here: DJIA chart

What do you think? I'd appreciate both FA and TA view.

Cheers!

TT
 
Hello all,

DJIA seems to be forming a huge head and shoulders market top. It seems that if we don't get a turn around from here (in the light of fundamentals there's not much hope) the H&S completes and the projection's at least to DJIA 10 000, and even below.


What do you think? I'd appreciate both FA and TA view.

Cheers!

TT
Although I dont trade the longer time frame or look at chart pattern formations I agree with you that if supprt fails (650-750) then it will tumble down further. my target for today is 650 your looking at the next few months, however theres amore important question to the one your asking, that is

Where would you put your stop loss for this trade?

I agree with you about the support you mentioned. There are the May 06 high, Jan 08 low and the 200 week MA all coinciding at around 11670. That support certainly has some bearing. However, I reckon we might have come below the major support already. That is the conjunction of historical support (based on the Mar 08 close) and the rising trendline at 11900. Together they should've halted the selling but it didn't happen and now - for the first time since the late 2003 - we might get a whole week that'll stay below that rising trend. We also have a new lower weekly close which further weakens the technical picture (chart).

About the stop strategy you mentioned. I'm not actually going to take a DJIA short based on this but if I did the stop could be above this week's high (?). I work in a bank and by combining the TA and FA try to figure out where our investors might want start accumulating stocks. Ie how long this downmarket might last. Judging from the fundamentals (housing, price of gas and food, consumer confidence, jobmarket figures, staglation fears) the DJIA 10 000 in a few months time doesn't sound too far fetched.

Because the FED rate decision didn't help the DOW to rise above the 11900 resistance, there migth well be further downside ahead. However, if the USD would substancially strenghten (and would therefore help the price of oil come off the escalated uptrend that it's in), I think we could get a rally that would last for a few weeks. But because the inflation and especially the price of oil is so important factor in the US economy at the moment, it would take a very significant downmove in Crude to change things for the longer term. Crude's now in such a strong uptrend that it can correct as much as 20 or 40 dollars and still remain in a rising trend (even though the latest escalation would be broken). See the chart.
 
Last edited:
Is this better? (see attached image; resistance line at 1550).

Hi,

I checked the link but couldn't find the formation you mentioned. Could you post a screenshot here (and perhaps draw the H&S formation on it)?

Cheers!

TT
 

Attachments

  • INX.JPG
    INX.JPG
    319.7 KB · Views: 311
Hi,
..(and perhaps draw the H&S formation on it)?
TT

Oh and I said it was a Double Top not H&S. Double tops are much easier to see and IMO very reliable, in fact in the world of tech analysis only double tops and one other indicator are of any value (to me).

jmh0
 
Hi,

sorry I didn't read your post properly. I focused on the bit "...here's another one" and assumed you were talking about an H&S. Sorry, my fault. Yes, that is a vast double top.

My experience is that the most reliable sell signal comes when market pushes itself to a new high and then fails to maintain the new levels. That is exactly what happened in your example: a push into new highs, a mid bar close and a drop below the previous high.

That tells you there is no professional money to support the market at higher prices, ie no demand at those levels. Some traders view this as a test performed by the professionals (those that have the power to move the market) others refer to it as a false breakout signal and talk about market manipulation.

What ever your view is, the fact remains that pretty often a major move in one direction is preceded by a false breakout / test in the opposite direction.
 
Top